
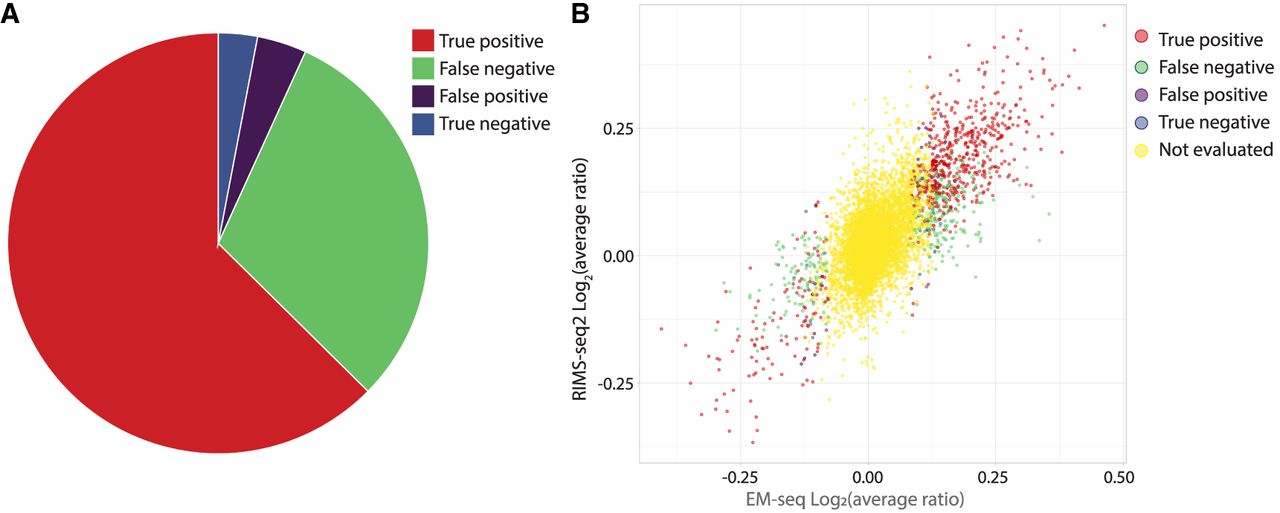
Figure 3.
DMR identification using RIMS-seq2. (A) Pie chart of the performance of RIMS-seq2 compared with EM-seq with the number of CpG islands (CGIs) that are found as true positive (red), false negative (green), false positive (purple), and true negative (blue). (B) Correlation between the differential methylation in EM-seq and RIMS-seq2. The “not evaluated” (yellow) category represents CGIs with differences <10%, which were not used for analysis.


