
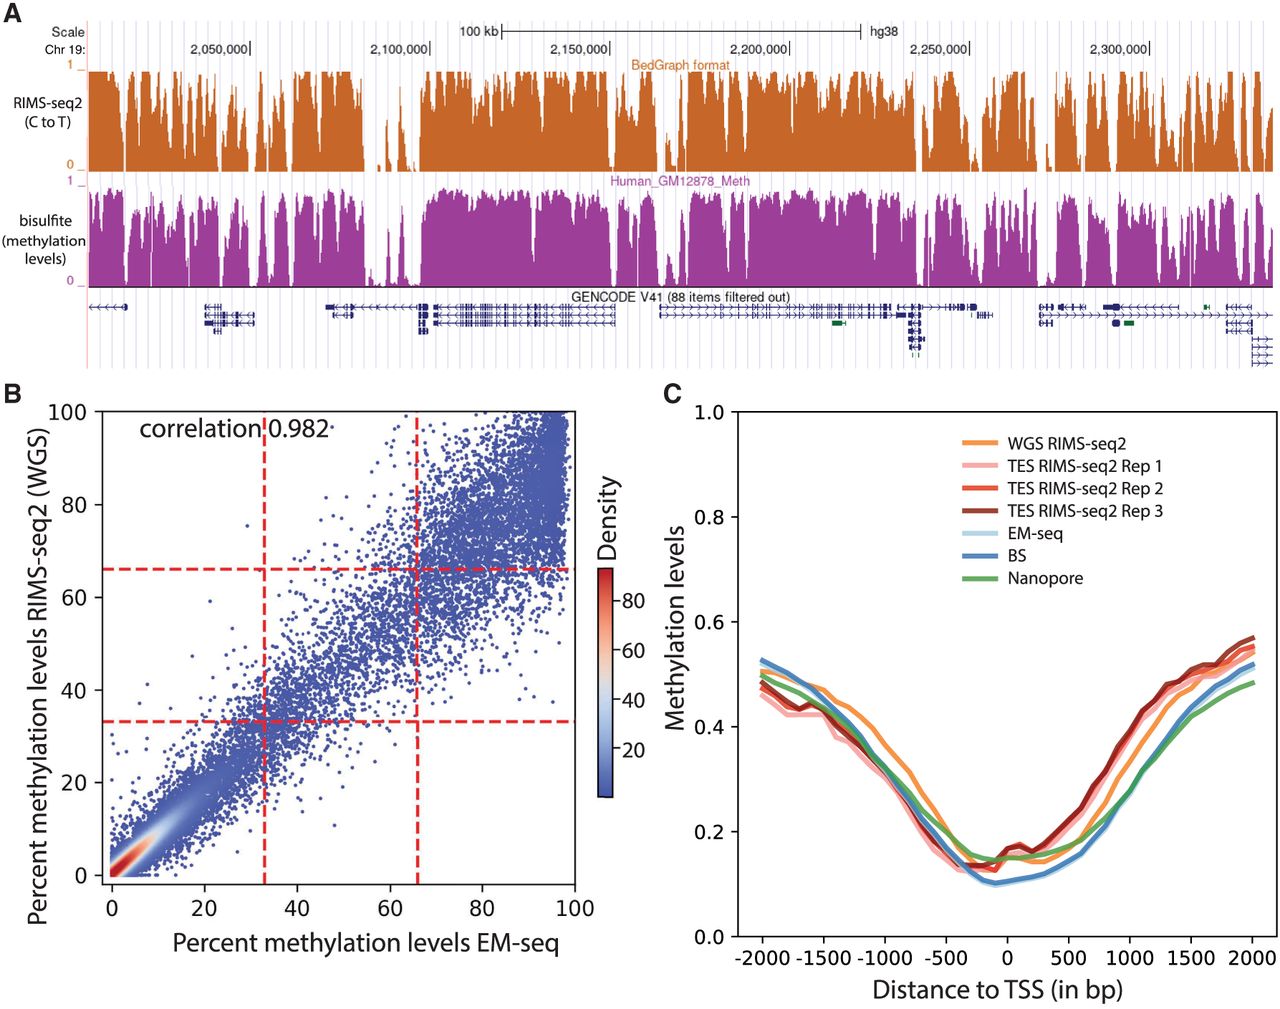
Performance of RIMS-seq2 (methylation). (A) C-to-T profile at a specific locus (combined 30 CpG sites) compared to methylation profile from bisulfite sequencing. (B) Methylation-level (RAML) correlation at CGIs between RIMS-seq2 and EM-seq. Each point corresponds to a CGI region (raw data provided in Supplemental Table S4). The plotting area has been divided into nine quadrants. (C) Methylation profiles at promoters measured by RIMS-seq2 (both WGS and TES), EM-seq (light blue), bisulfite sequencing (dark blue), and Nanopore (green). The overall percentage methylation of CpG sites was measured using 100 bp sliding windows within 2 kb upstream of and downstream from transcription start sites (TSSs). TSSs were defined using UCSC annotation. Distance to a TSS is measured in base pairs.


