
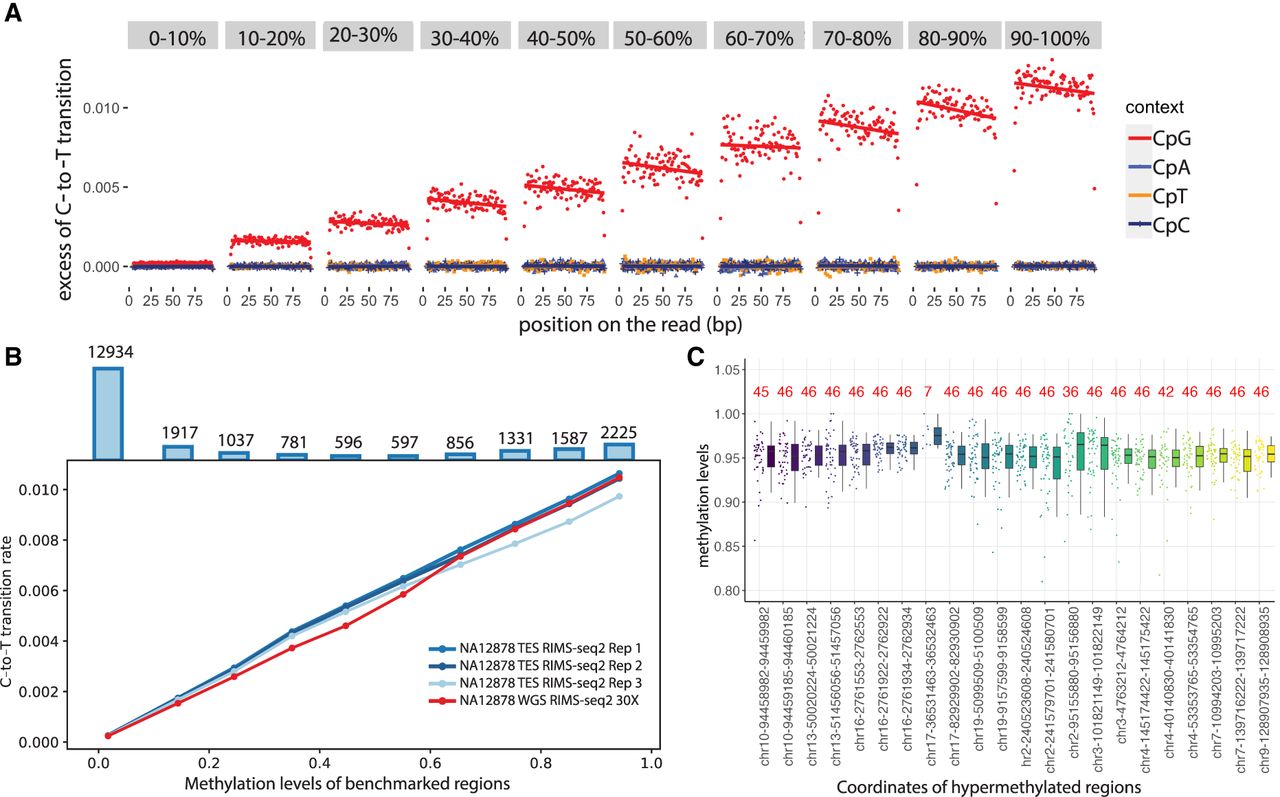
Linear relationship between transition rates and methylation levels. (A) Whole-genome RIMS-seq2 excess of C-to-T transition rates in read 1 compared with read 2 (imbalance) function of the position on the read (in base pairs). CGI regions are binned into 1%–10% to 90%–100% methylation levels. The rate of C-to-T transition in each bin was computed for CpG (red), CpA (blue), CpT (orange), and CpC (purple) contexts. (B) The rate of C-to-T transition and benchmarked methylation in binned CGIs fits a positive linear regression model for all NA12878 RIMS-seq2 whole-genome sequencing (red) and exome sequencing in triplicates (blue). Top bar plots represent the total number of CGI in each bin. (C) Twenty-two stably methylated regions across a broad range of tissues and cell types used as internal control for methylation level calibration. The number in red indicates the number of available human WGBS samples used for methylation analysis. Genomic regions coordinates are derived from the human genome (GRCh38).


