
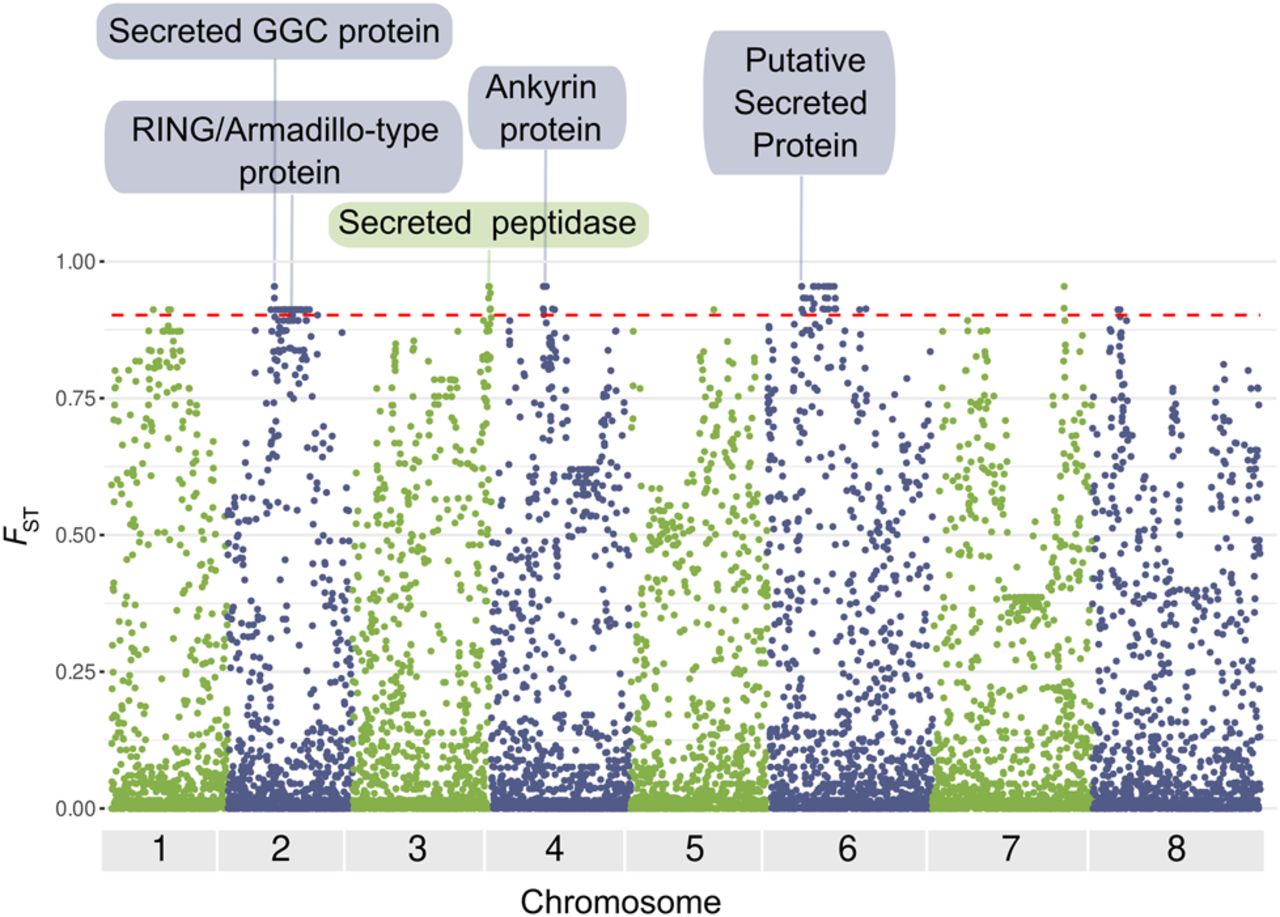
Figure 4.
Manhattan plot of genome-wide Wright's Fst values, calculated in genomic regions of 1 kb, comparing population 2 and population 3. Fst values are shown on the y-axis and genomic positions on the x-axis. The dotted red line represents the cutoff value for the top 1%, equal to 0.91. Genes overlapping with the BUSTED analysis and with a function potentially associated with virulence or host–pathogen interactions are highlighted.


