
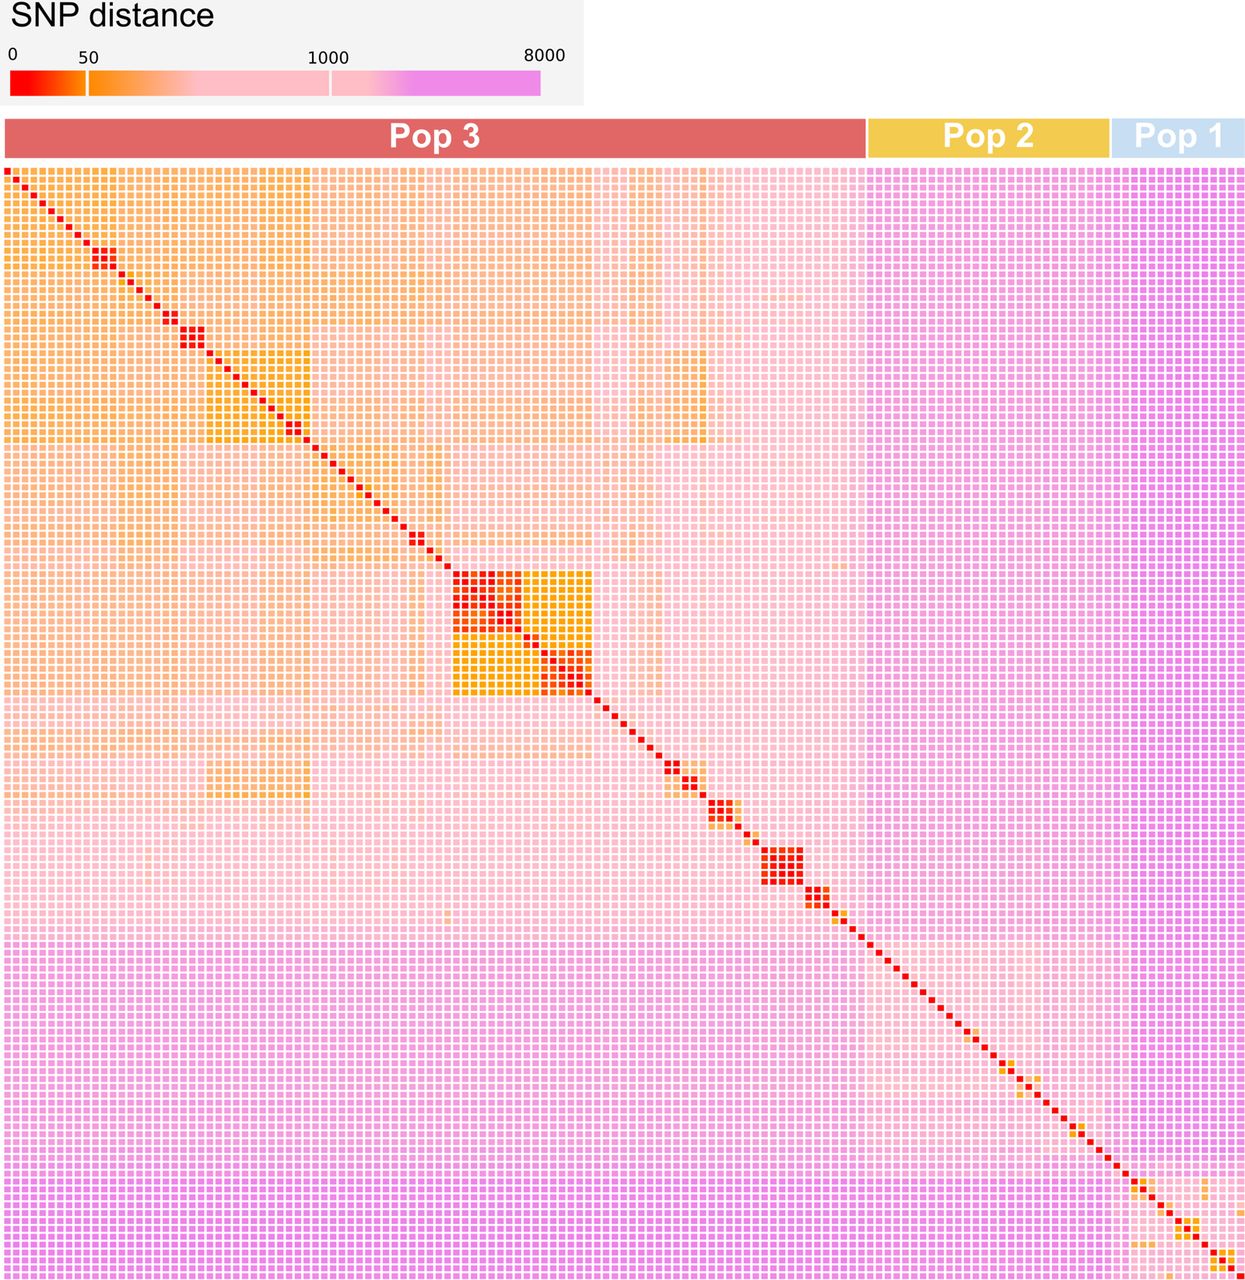
Figure 2.
Heat map illustrating pairwise SNP distances among the 141 isolates analyzed. The order of the isolates reflects the position they occupy in the SNP-based phylogenetic tree. The color code is shown in the legend on the top.


