
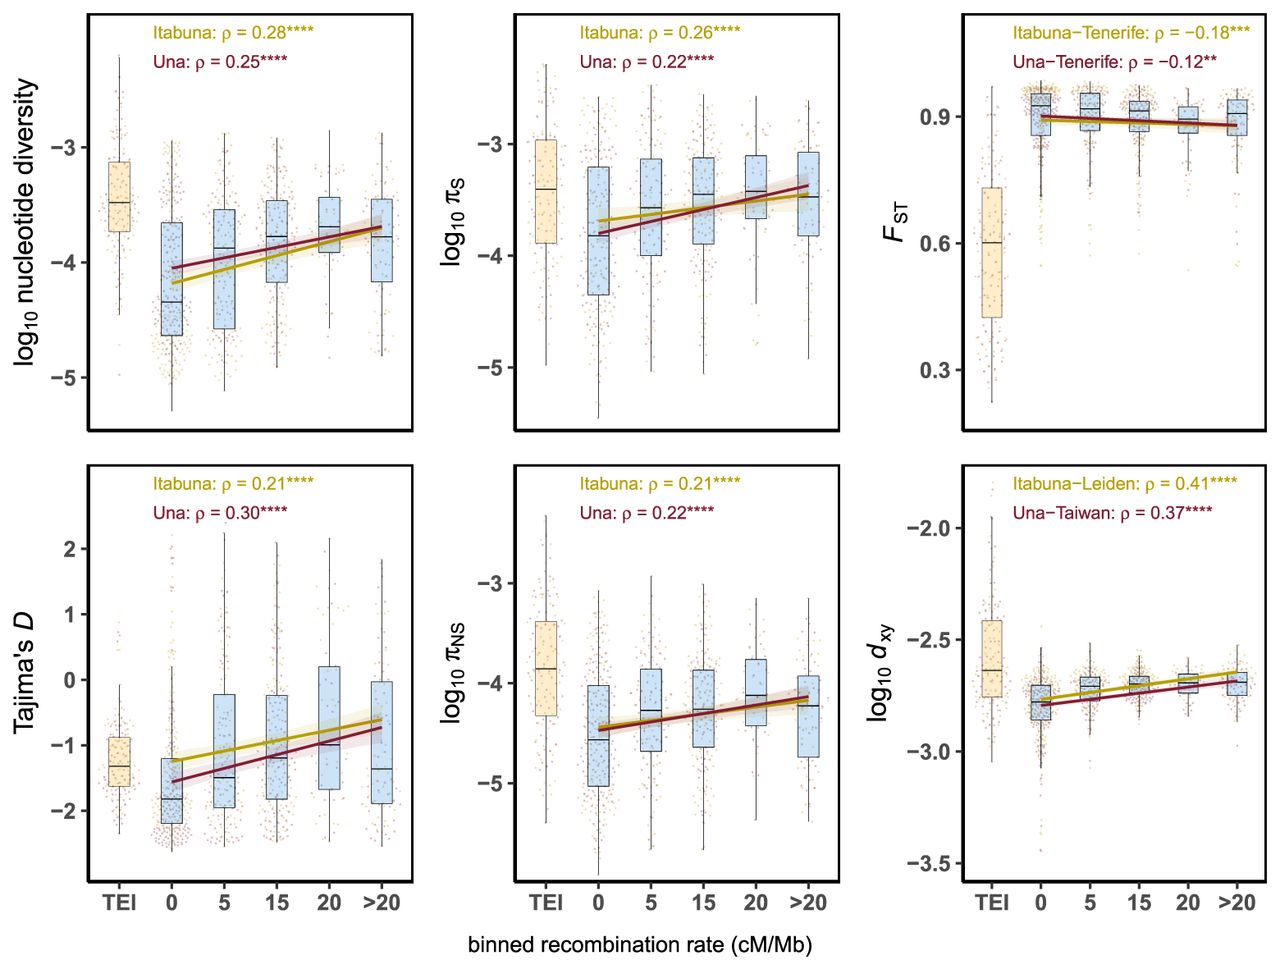
Relationship between recombination rates and measures of diversity in populations of C. obscurior. (Left) Correlation between recombination rates and nucleotide diversity and Tajima's D. (Middle) Correlation between recombination rates and nucleotide diversity at synonymous (πS) and nonsynonymous (πNS) sites. (Right) Correlation between recombination rates and levels of genetic differentiation (FST) and absolute divergence (dXY) between lineages of C. obscurior. The x-axis represents binned recombination rates, with the upper limit of each bin indicated and “TEI” referring to TE islands (orange boxplot). (ρ) Spearman's rank correlation coefficient, with significance shown by asterisks: (****) P < 0.0001, (***) P < 0.001, (**) P < 0.01. All correlations were performed using the raw data. Lines and shaded areas are linear regressions and 95% confidence intervals.


