
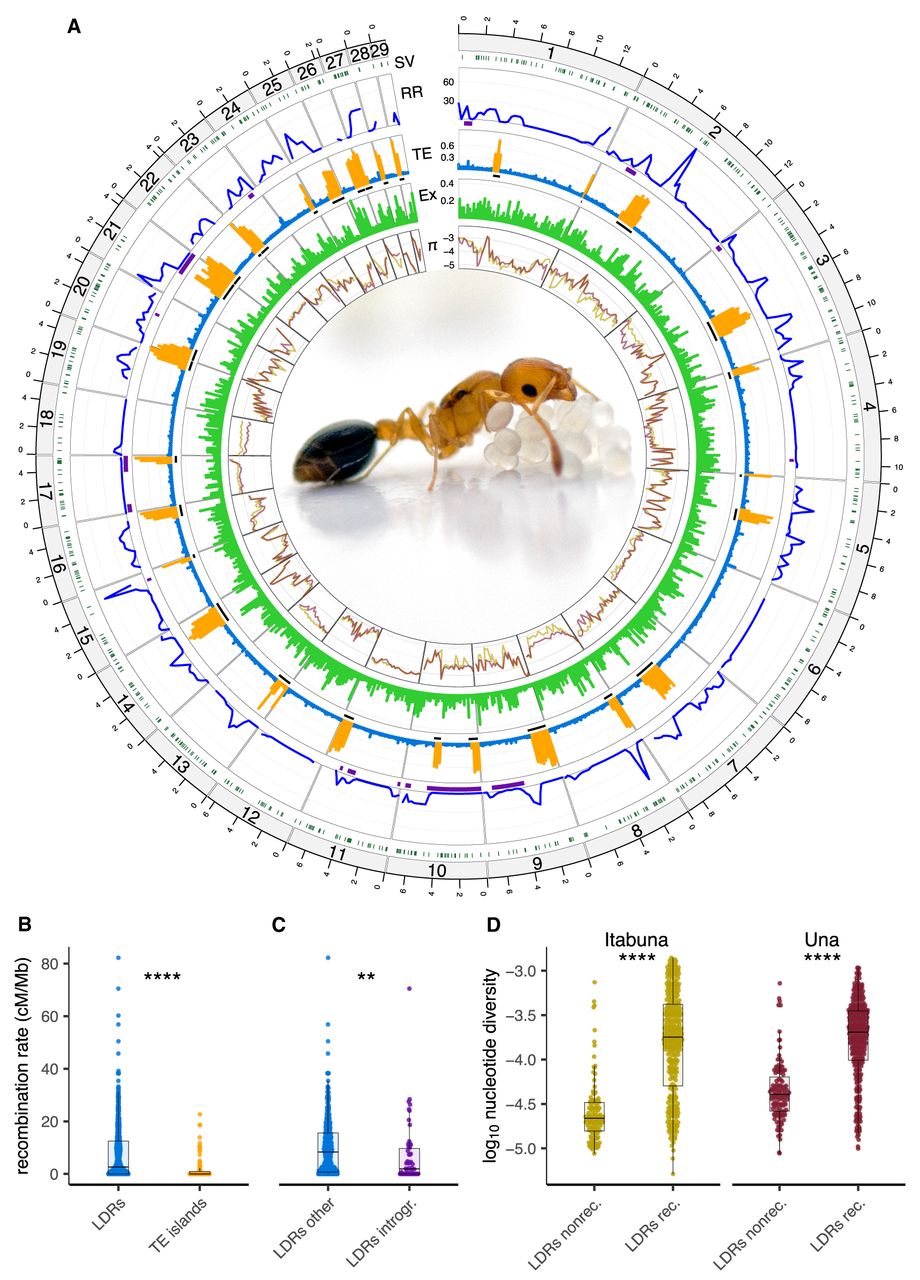
Recombination rate variation and genome architecture in C. obscurior. (A) Circos plot showing the following inward: (SV) the location of identified structural variants (dark green), (RR) recombination rates across the genome (cM/Mb) with introgressions depicted with purple bars, (TE) TE content (“LDRs”, blue; “TE islands”, orange) with the location of TE islands shown as black bars, (Ex) exon content, and (π) the log10-transformed nucleotide diversity in two natural populations for C. obscurior from Itabuna (gold) and Una (maroon). C. obscurior queen with brood (photo: L. Schrader). (B) Recombination rates between TE-poor regions (“LDRs” in blue) and TE-rich regions (“TE islands” in orange). (C) Recombination rates in introgressed regions (“LDRs introgr.” In purple) compared with the remainder of LDRs (“LDRs other” in blue). (D) Levels of nucleotide diversity (π) in nonrecombining (“LDRs nonrec.”) compared with recombining regions LDRs (“LDRs rec.”) in two populations of C. obscurior from Itabuna and Una. (****) P < 0.0001, (**) P < 0.01.


