
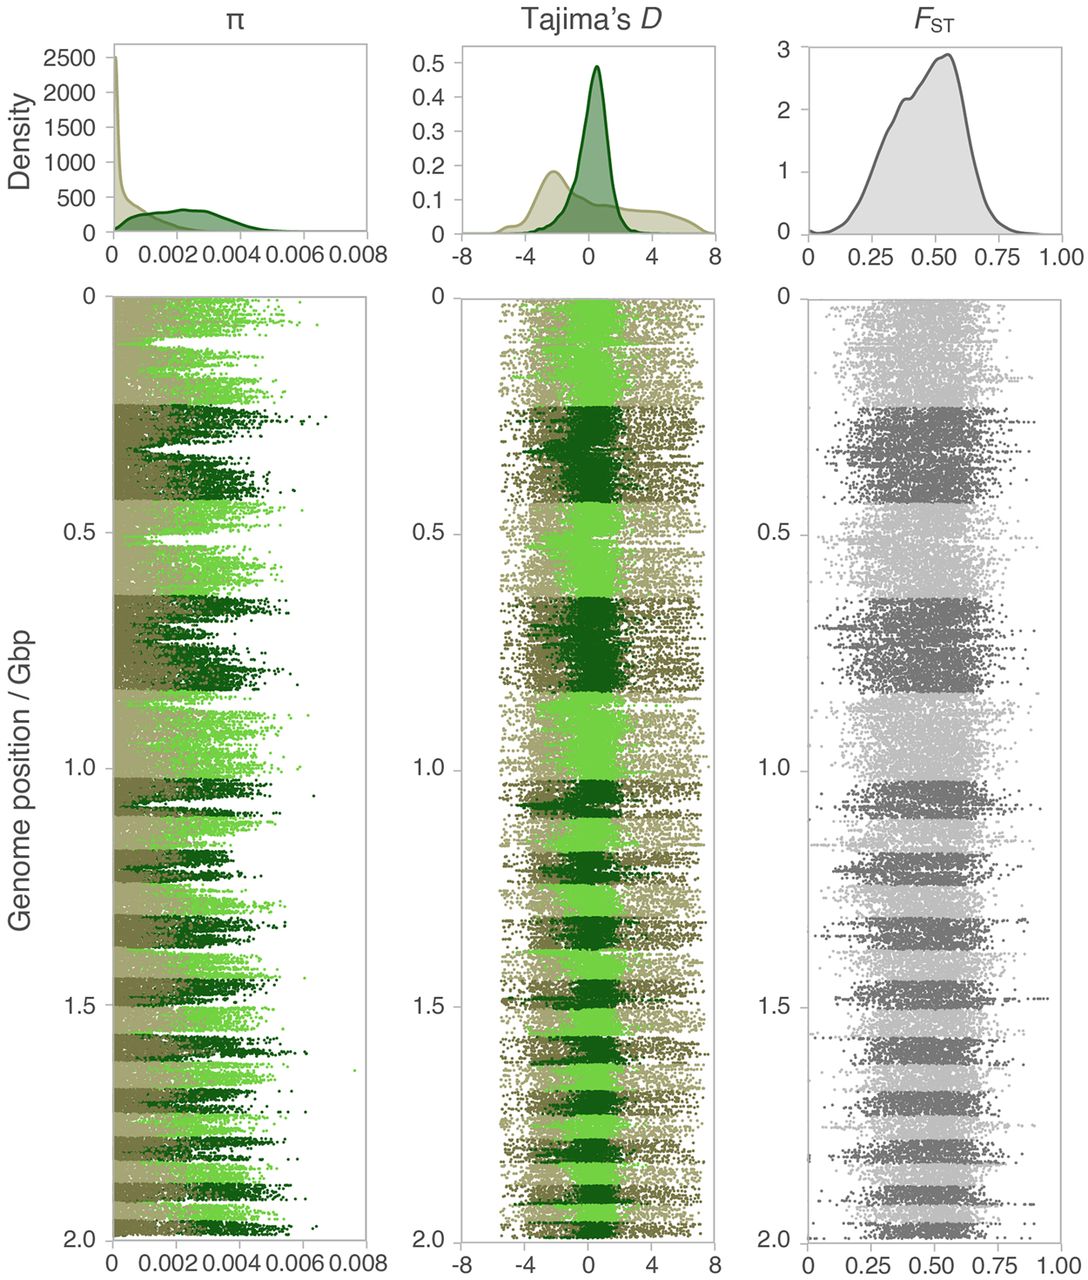
Figure 2.
Genome-wide diversity and differentiation for common voles, M. arvalis, from the Orkney archipelago (brown) versus continental individuals (green). Density distributions (top) and Manhattan plots (bottom) for π, Tajima's D, and FST in 50 kb windows along the genome. Different chromosomes are marked with lighter and darker colors.


