
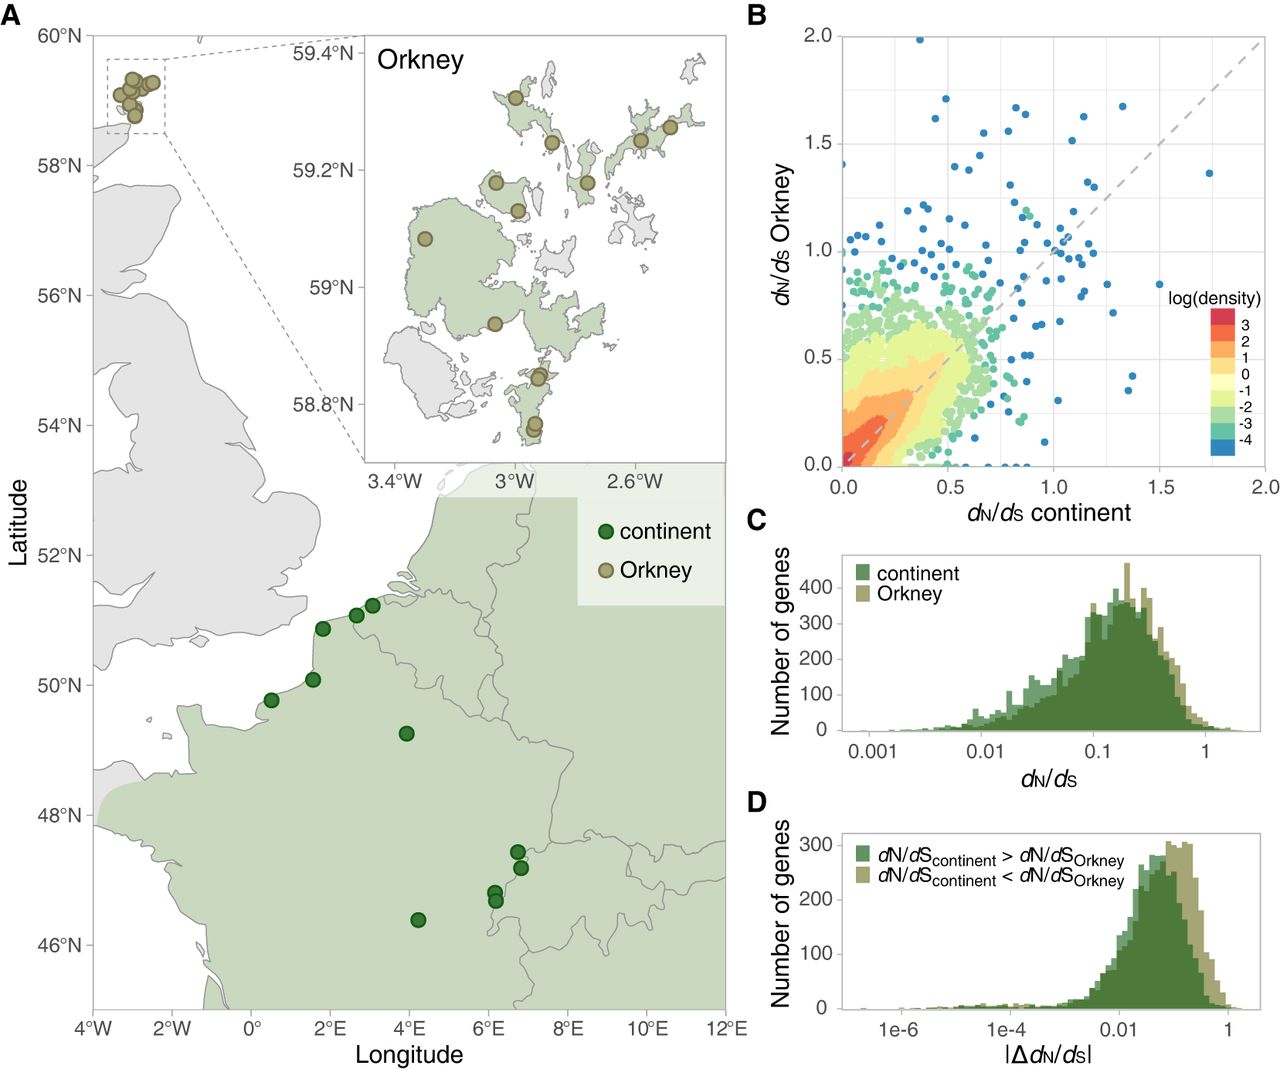
Sample distribution and comparison of dN/dS ratios. (A) Sample locations of the common vole M. arvalis in western Europe and Scotland. Continental samples are marked with green; Orkney samples, with brown. The distribution range of M. arvalis is marked with light green. Note that the species is absent from the British Isles except for Orkney. (B) For each gene, the dN/dS ratio of continental voles was plotted against the ratio of Orkney voles. There were more genes with higher ratio in Orkney than in the continent. The dashed line marks an equal dN/dS in both groups. The density of the points is marked with colors. (C) Distribution of dN/dS ratios of Orkney voles versus continental voles. (D) For the genes with |Δ dN/dS| > 0 between Orkney and continental voles, values were overall biased toward a higher dN/dS ratio in Orkney voles.


