
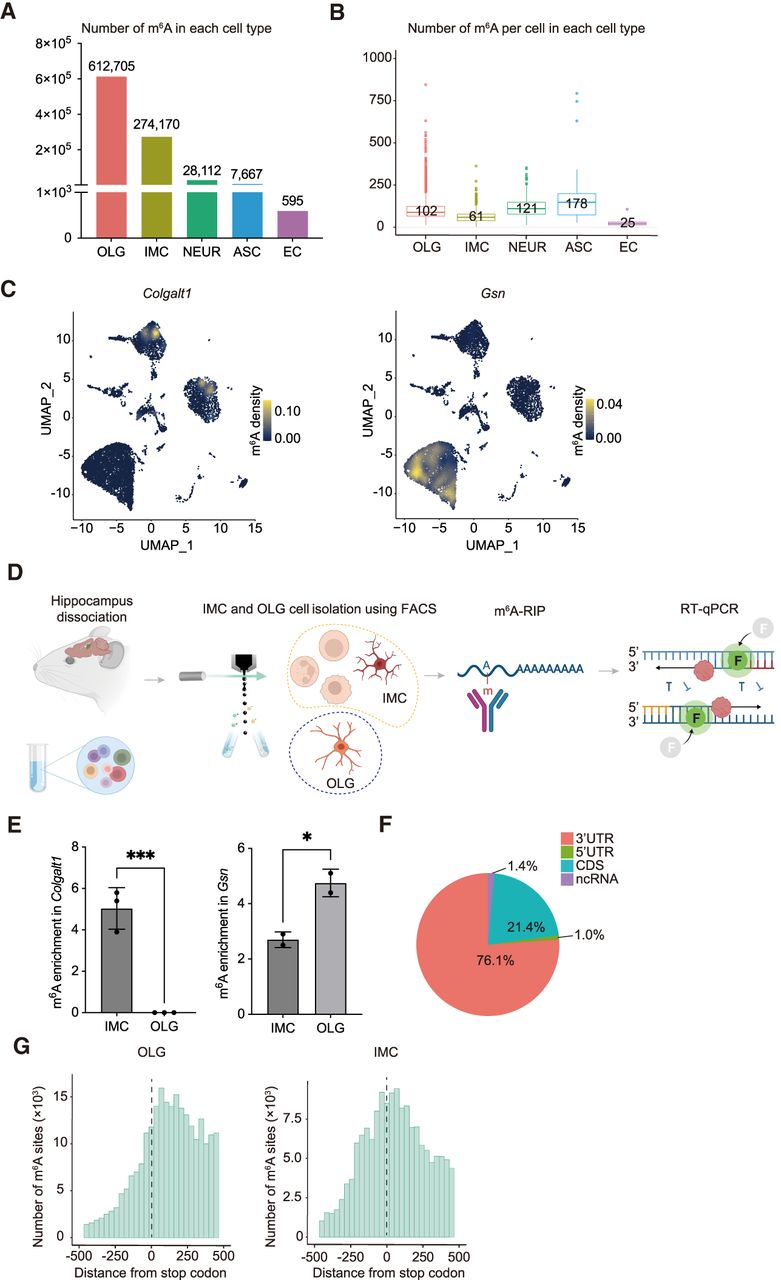
m6A single-cell distribution per mouse hippocampal cell type. (A) m6A counts per cell type. (OLG) oligodendrocyte cell lineage, (IMC) immune cell lineage, (NEUR) neuronal cell lineage, (ASC) astrocyte cell lineage, (EC) endothelial cell lineage. (B) m6A counts per cell for each cell type. Number reflects average. (C) UMAP illustrating the m6A density on RNA transcribed from one gene, per cell. Plots for genes Colgalt1 and Gsn are shown. Legend color represents density of m6A on RNA transcribed. (D) Schematic diagram of approach confirming differential m6A RNA modifications in different cell populations. Relevant cell groups from hippocampi are isolated by FACS sorting, such as IMC versus OLG, followed by m6A RNA immunoprecipitation (m6A-RIP), reverse transcription, and qPCR (RT-qPCR). m6A-RIP enrichment represents relative m6A abundance in different cell populations. (E) m6A transcript enrichment quantifications in IMC and OLG populations following m6A-RIP and RT-qPCR versus input control samples. Transcript m6A enrichments represent m6A abundance in IMC and OLG cells. Both transcripts of Colgalt1 and Gsn were detected in all input control samples. No Colgalt1 transcripts were detected following m6A-RIP in OLG. Unpaired t-test (two-tailed) was used to test the difference between OLG compared with IMC. (***) P ≤ 0.001, (*) P ≤ 0.05. (F) m6A distribution within RNA. Data represent pooled single-cell data. (CDS) coding site, (ncRNA) noncoding RNA. (G) m6A distribution surrounding the stop codon (0 nt) identified by single-cell sequencing for OLG and IMC.


