
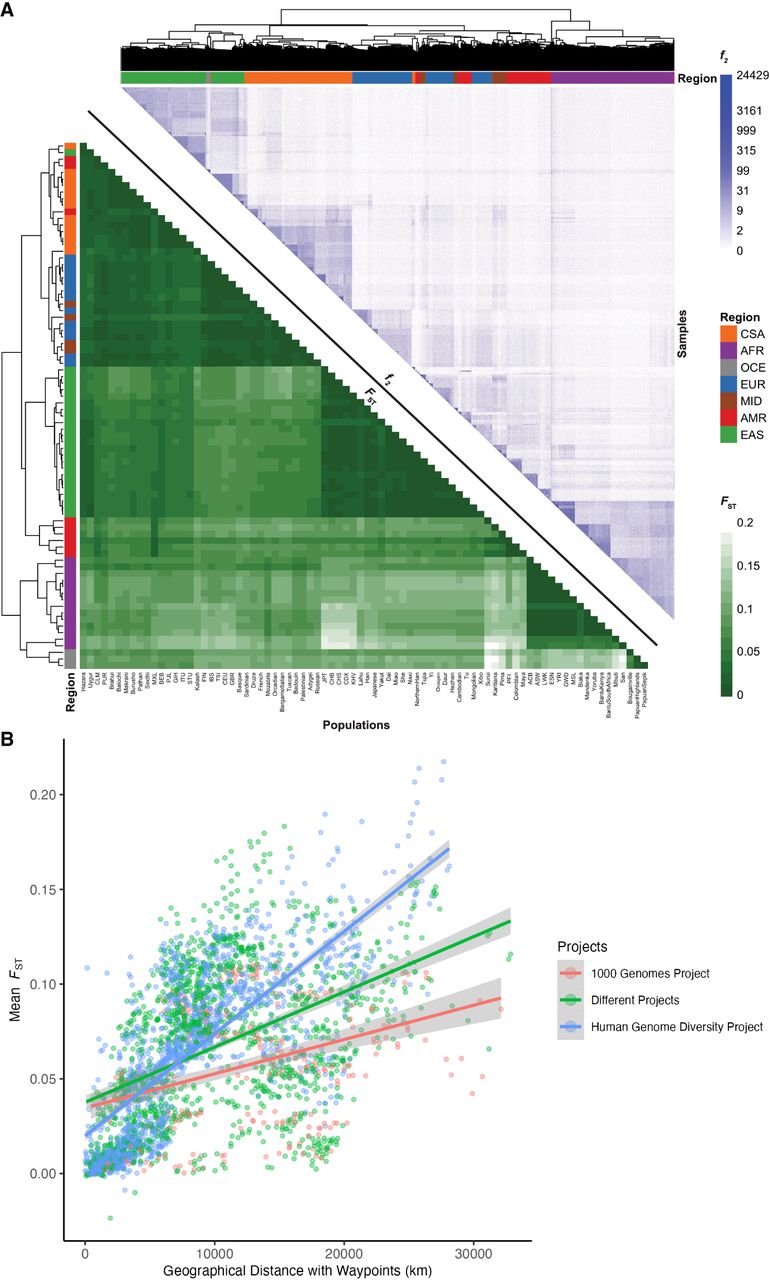
Relationships between genetic differentiation measured from common variants (FST), rare variants (f2), and geography. (A, lower triangle) FST heatmap illustrating genetic divergence between pairs of populations. (Upper triangle) Heatmap of f2 comparisons of doubleton counts between pairs of individuals. Column and row colors at the leaves of the dendrogram show colors corresponding to metadata geographical/genetic regions, and the top right color bar indicates the number of doubletons shared across pairs of individuals, with more doubletons shared among individuals within the same populations and geographical/genetic regions. Interspersals of populations by metadata labels are shown in Supplemental Figure S18 and Supplemental Table S7. (B) Genetic divergence measured by FST versus geographical distance with five waypoints calculated using the haversine formula (earth's radius = 6371 km).


