
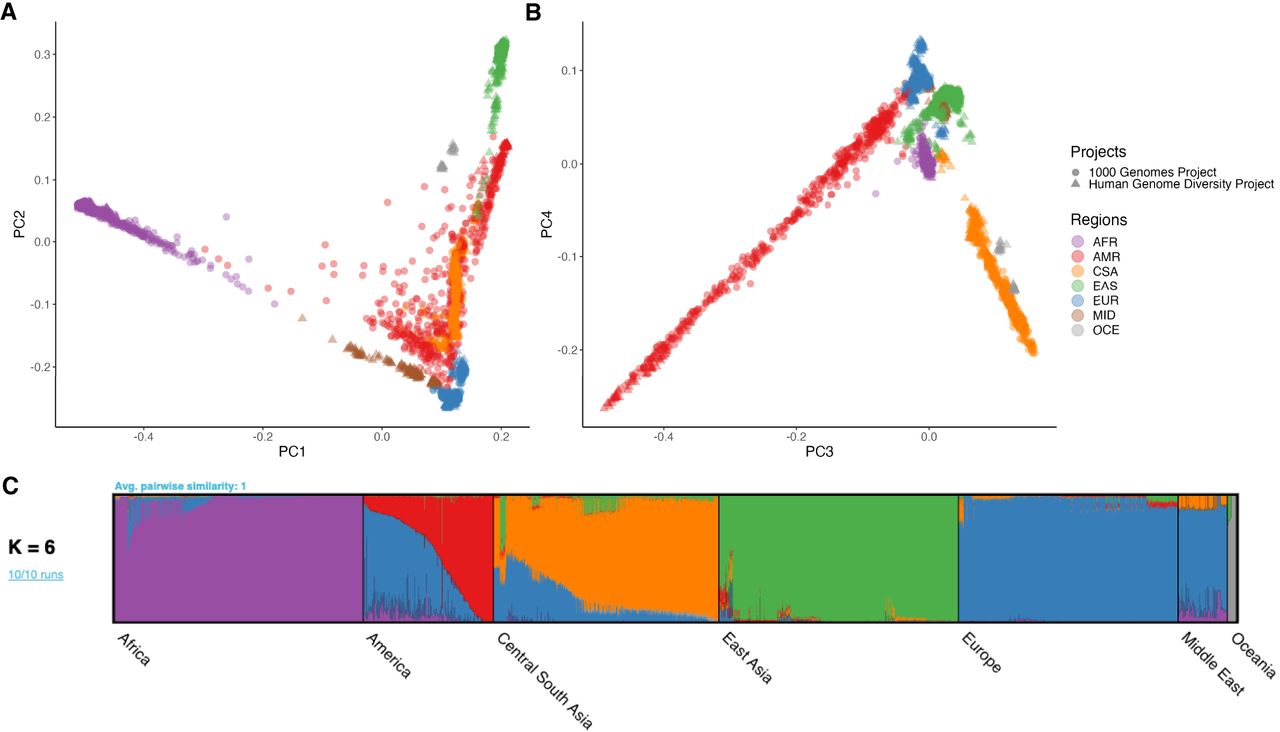
Figure 2.
Global ancestry analysis of genetic structure in the HGDP and 1kGP resource. Regional abbreviations are as in Figure 1. (A,B) Principal components analysis (PCA) plots for PC1 versus PC2 (A) and PC3 versus PC4 (B) showing global ancestry structure across HGDP + 1kGP. Subsequent PCs separated structure within geographical/genetic regions (Supplemental Figs. S9–S16). (C) ADMIXTURE analysis at the best-fit value of K = 6.


