
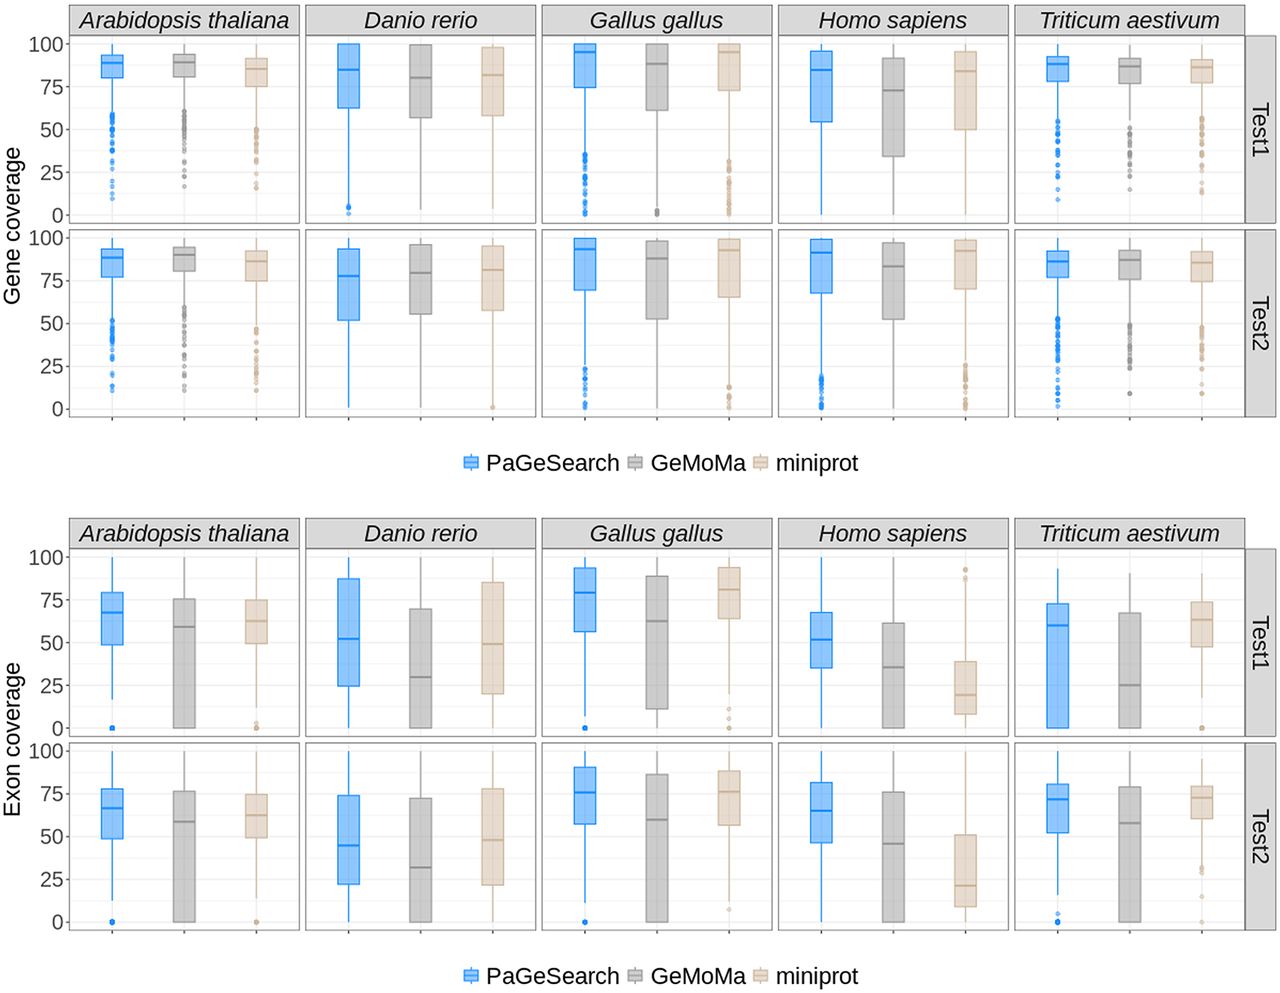
Figure 3.
The distributions of gene and exon coverages for true-positive regions, as identified by PaGeSearch, GeMoMa, and miniprot, categorized by archetype species and the test species used for validation.
(Downloading may take up to 30 seconds. If the slide opens in your browser, select File -> Save As to save it.)
Click on image to view larger version.
The distributions of gene and exon coverages for true-positive regions, as identified by PaGeSearch, GeMoMa, and miniprot, categorized by archetype species and the test species used for validation.
 CiteULike
 Delicious
 Digg
Digg Facebook
 Google+
 Reddit
 Twitter
