
Figure 8.
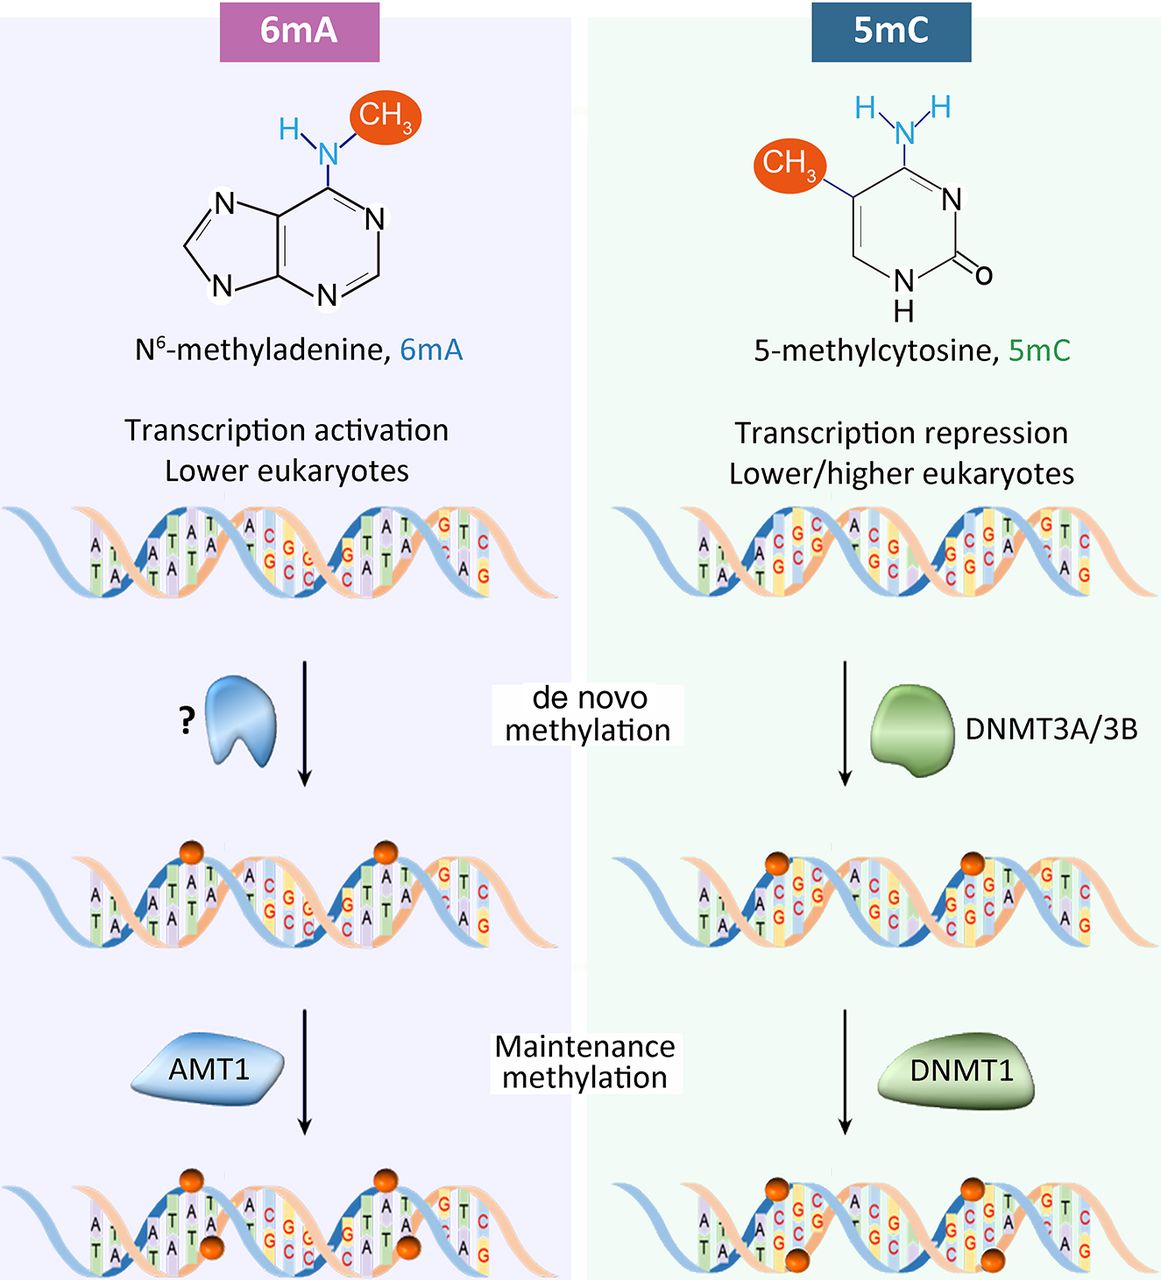
Comparison of 6mA and 5mC pathways in eukaryotes. See text for details.
(Downloading may take up to 30 seconds. If the slide opens in your browser, select File -> Save As to save it.)
Click on image to view larger version.
Comparison of 6mA and 5mC pathways in eukaryotes. See text for details.
 CiteULike
 Delicious
 Digg
Digg Facebook
 Google+
 Reddit
 Twitter
