
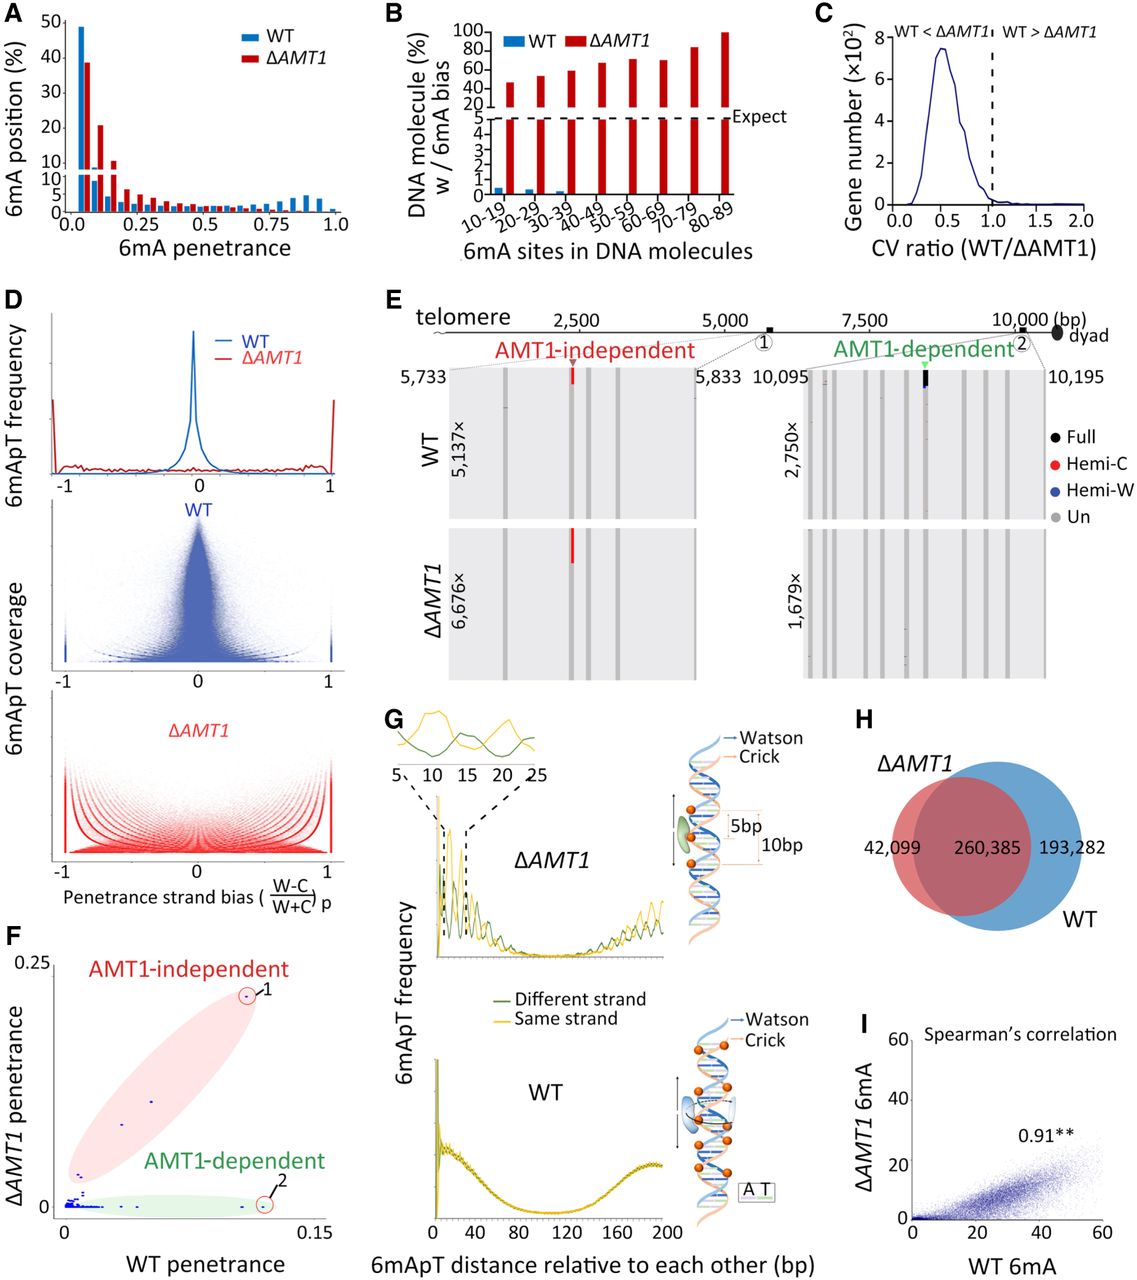
AMT1-independent de novo methylation. (A) Depletion of high penetrance 6mA positions in ΔAMT1 relative to WT cells. (B) Strong 6mA segregation strand biases in ΔAMT1 cells. Chi-squared analysis was performed on DNA molecules with the specified number of total 6mA (full-6mApT counted as
two, hemi-6mApT counted as one; x-axis), the percentage of DNA molecules with a strong bias for 6mA segregation to one strand was indicated (expectance <5%,
assuming random distribution; y-axis). WT cells were also analyzed as a negative control. (C) Increased 6mA variability at the gene level in ΔAMT1 relative to WT cells. For each gene, we calculated the coefficient of variance (CV) of 6mA counts from individual DNA molecules
fully covering the gene, for WT and ΔAMT1 cells, respectively. We then plotted the distribution of the ratio between the two CV values (WT 1) across all genes. Note that for most genes, the ratio is <1 (i.e., 6mA variability is higher in ΔAMT1 than WT cells). (D) Penetrance strand bias of 6mA in WT and ΔAMT1 cells. 6mA penetrance strand bias is defined for an ApT position in the genome as the difference-sum ratio between the number
of DNA molecules supporting 6mA on W and C, respectively: [(W − C)/(W + C)]p. We plotted the distribution of ApT genomic positions according to their penetrance strand bias (top). We also plotted their distribution according to both penetrance strand bias and 6mApT coverage (middle: WT; bottom: ΔAMT1). In WT cells, most ApT positions had penetrance strand bias values around 0 (i.e., similar numbers of 6mA on W and C), whereas
few had values at +1 (6mA only on W) or −1 (6mA only on C). The latter most likely corresponds to genomic positions exclusive
for AMT1-independent methylation (Fig. 6F, left panel). The opposite was true for ΔAMT1 cells. (E) Representative genomic positions in Tetrahymena rDNA (top schematic: only the left half of the palindromic dimer, from telomere to dyad, is shown) targeted by AMT1-independent (left) and AMT1-dependent methylation (right). Note that 6mA occurs only on one strand in AMT1-independent methylation, but on both strands in AMT1-dependent methylation.
(F) 6mA penetrance of individual genomic positions in WT and ΔAMT1 cells. Note the two distinct groups corresponding to (1) AMT1-independent and (2) AMT1-dependent methylation. (G) 10 bp cycle of 6mA penetrance strand bias in ΔAMT1 cells (top left), suggesting that the dedicated de novo 6mA-MTase can only approach the DNA substrate from one side (top right). Lack of such a pattern in WT cells (bottom left) supports that the AMT1 complex can approach from different sides (bottom right). (H) Overlap in ApT positions methylated in WT or ΔAMT1 cells (6mA penetrance ≥0.1). (I) 6mA levels of individual genes in WT and ΔAMT1 cells are strongly correlated. Each gene is assigned a coordinate: the sum of 6mA penetrance values for all methylated ApT
positions in the gene body (ΣP) for WT (x-axis) and ΔAMT1 cells (y-axis). The Spearman's rank correlation coefficient is significant: (**) P < 0.01.
1) across all genes. Note that for most genes, the ratio is <1 (i.e., 6mA variability is higher in ΔAMT1 than WT cells). (D) Penetrance strand bias of 6mA in WT and ΔAMT1 cells. 6mA penetrance strand bias is defined for an ApT position in the genome as the difference-sum ratio between the number
of DNA molecules supporting 6mA on W and C, respectively: [(W − C)/(W + C)]p. We plotted the distribution of ApT genomic positions according to their penetrance strand bias (top). We also plotted their distribution according to both penetrance strand bias and 6mApT coverage (middle: WT; bottom: ΔAMT1). In WT cells, most ApT positions had penetrance strand bias values around 0 (i.e., similar numbers of 6mA on W and C), whereas
few had values at +1 (6mA only on W) or −1 (6mA only on C). The latter most likely corresponds to genomic positions exclusive
for AMT1-independent methylation (Fig. 6F, left panel). The opposite was true for ΔAMT1 cells. (E) Representative genomic positions in Tetrahymena rDNA (top schematic: only the left half of the palindromic dimer, from telomere to dyad, is shown) targeted by AMT1-independent (left) and AMT1-dependent methylation (right). Note that 6mA occurs only on one strand in AMT1-independent methylation, but on both strands in AMT1-dependent methylation.
(F) 6mA penetrance of individual genomic positions in WT and ΔAMT1 cells. Note the two distinct groups corresponding to (1) AMT1-independent and (2) AMT1-dependent methylation. (G) 10 bp cycle of 6mA penetrance strand bias in ΔAMT1 cells (top left), suggesting that the dedicated de novo 6mA-MTase can only approach the DNA substrate from one side (top right). Lack of such a pattern in WT cells (bottom left) supports that the AMT1 complex can approach from different sides (bottom right). (H) Overlap in ApT positions methylated in WT or ΔAMT1 cells (6mA penetrance ≥0.1). (I) 6mA levels of individual genes in WT and ΔAMT1 cells are strongly correlated. Each gene is assigned a coordinate: the sum of 6mA penetrance values for all methylated ApT
positions in the gene body (ΣP) for WT (x-axis) and ΔAMT1 cells (y-axis). The Spearman's rank correlation coefficient is significant: (**) P < 0.01.


