
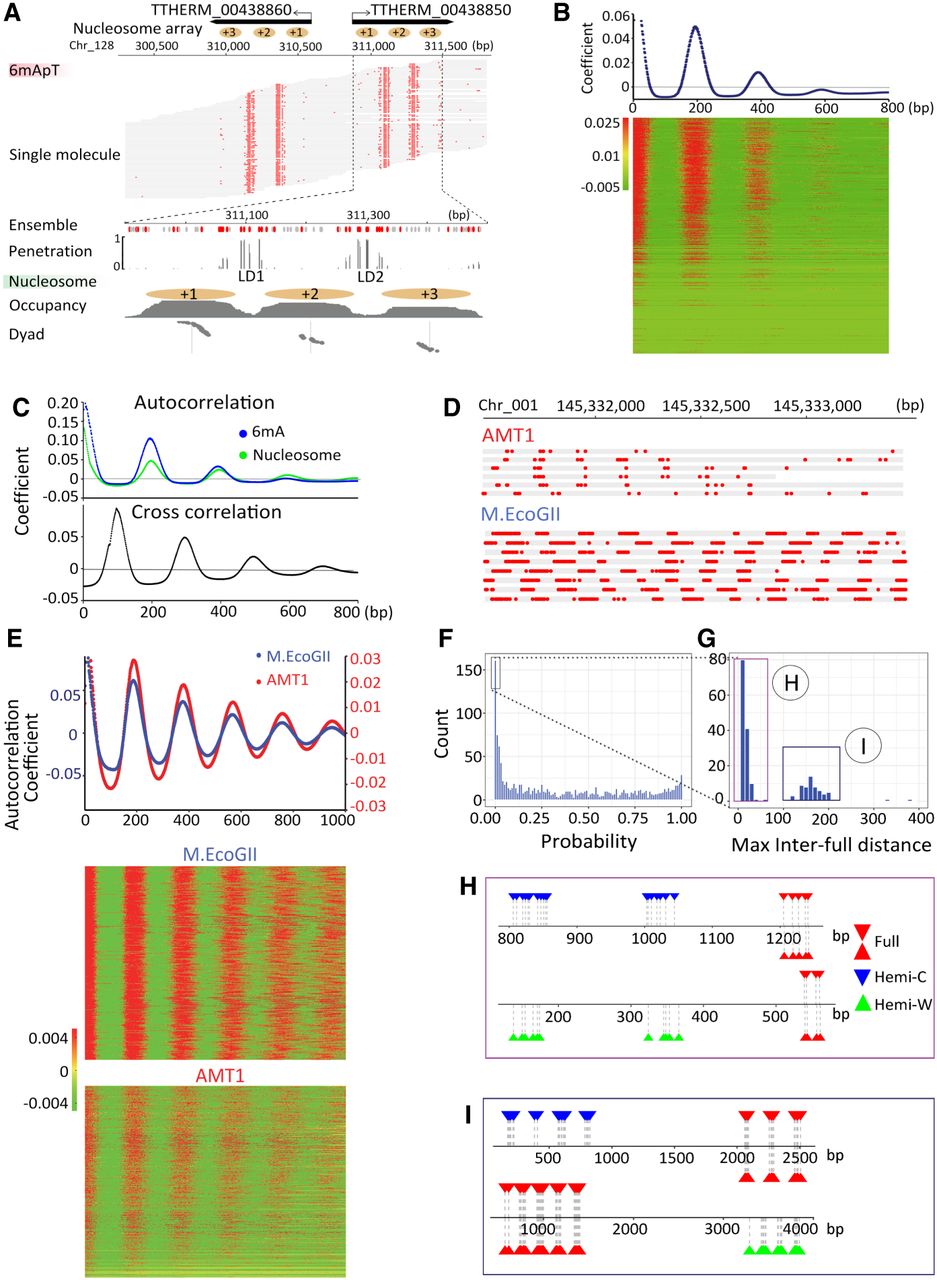
Chromatin-guided 6mA transmission. (A) 6mA and nucleosome distributions in Tetrahymena. A typical genomic region is shown with SMRT CCS reads mapped across it, as well as annotations of genes and canonical nucleosome arrays (Xiong et al. 2016). Note that 6mApT sites (in either full or hemi-methylation, red dot) distributed along individual DNA molecules (gray line) are clustered in linker DNA (LD). LD1 is between the +1 and +2 nucleosome (the first and second nucleosome downstream from TSS); LD2 and beyond are defined iteratively further downstream from the gene body. (B) Periodic 6mA distribution at the single-molecule level in Tetrahymena. Autocorrelation between 6mA sites was calculated for individual DNA molecules, ranked by their median absolute deviations, and plotted as a heat map (bottom) and an aggregated correlogram (top). (C) Autocorrelation of 6mA and nucleosome distributions at the ensemble level in Tetrahymena (top), revealing a ∼200 bp periodicity. Cross-correlation between 6mA and nucleosome distributions (bottom), revealing an ∼100 bp phase difference between them. (D) Typical DNA molecules from human chromatin, after in vitro methylation by AMT1 complex and M.EcoGII, respectively. Note clusters of 6mA sites (red dot) distributed at regular intervals along individual DNA molecules (gray line). The difference in 6mA density is mostly due to the much lower density of the ApT dinucleotide that is preferred by the AMT1 complex, relative to essentially all A sites that can be targeted by M.EcoGII. Additionally, the AMT1 complex may also have reduced chromatin accessibility relative to M.EcoGII, due to its much larger size. (E) Periodic 6mA distributions at the single-molecule level, after in vitro methylation by AMT1 complex and M.EcoGII, respectively. Autocorrelation between 6mA sites was calculated for individual DNA molecules, ranked by their median absolute deviations, and plotted as heat maps (bottom) and aggregated correlograms (top). DNA molecules with regularly spaced 6mA clusters were found across euchromatic and heterochromatic regions. Heterochromatin is known to have low nucleosome positioning, which means at the ensemble level, nucleosomes can occupy alternative genomic positions. However, at the single-molecule level, nucleosomes are still regularly spaced, which is only obvious in long-read, single-molecule sequencing results. (F) Congregation of full-6mApT in DNA molecules undergoing hemi-to-full conversion. Their max inter-full distances were often very small, thus rarely represented (probability ≤0.01) in simulations with permutated full and hemi positions (box); x-axis: the probability for simulated max interfull distances to be no greater than the observed value; y-axis: the count of DNA molecules with the corresponding probability. (G) Distribution of max interfull distances for DNA molecules with strong full-6mApT congregation (probability ≤0.01, Fig. 5F, box). Note the two peaks corresponding to DNA molecules with full-6mApT congregation within an LD (Fig. 5H) and across adjacent LDs (Fig. 5I), respectively. (H) Full-6mApT congregation within an LD. (I) Full-6mApT congregation across adjacent LDs.


