
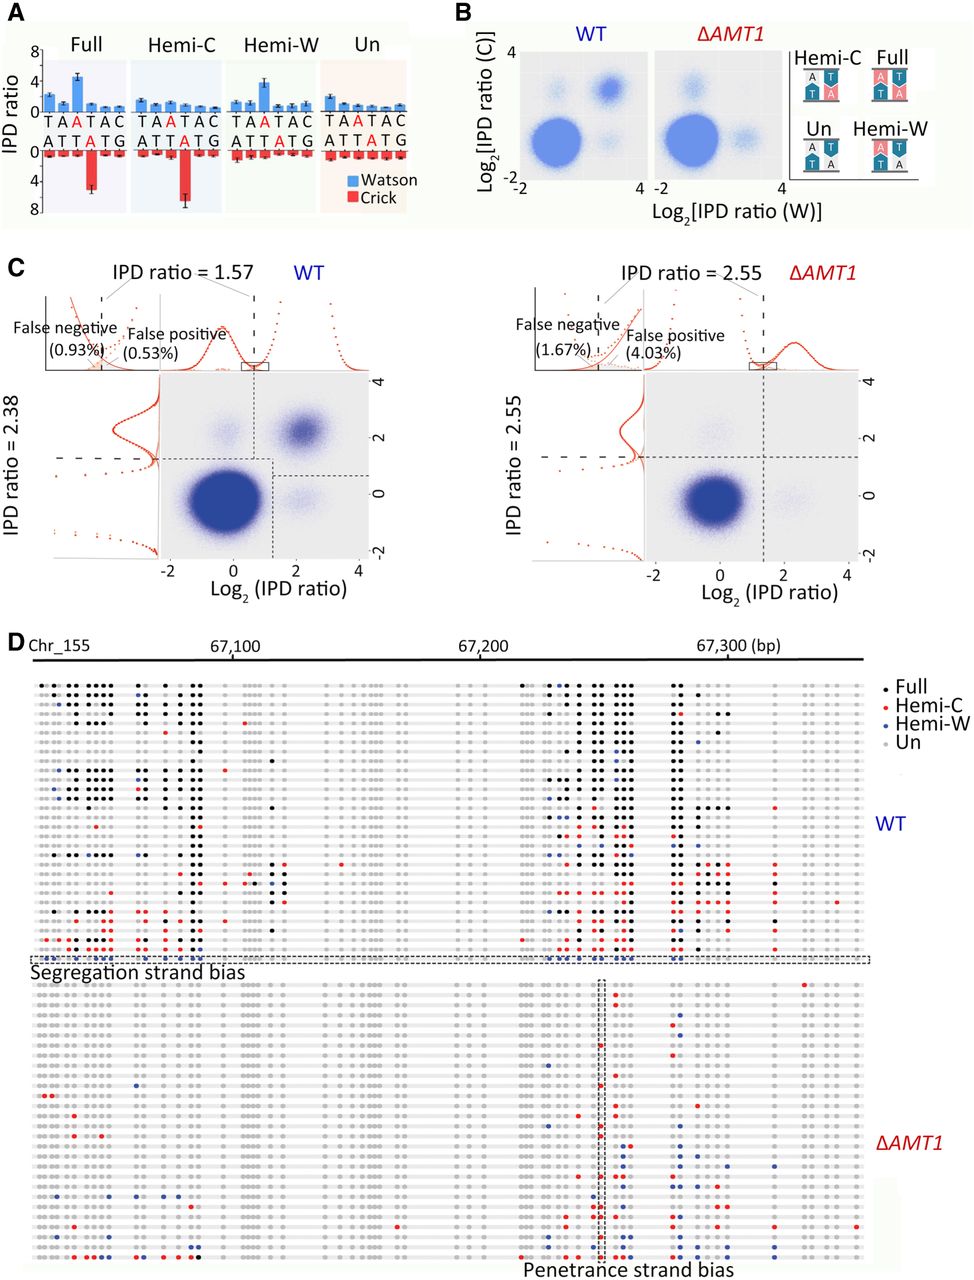
Distinguishing hemi- and full-6mApT. (A) Four states of ApT duplexes: full methylation, hemi-W, hemi-C, and unmethylated, distinguished by IPDr of adenine sites on W and C, respectively. (B) Distribution of ApT duplexes according to IPDr of adenine sites on W and C, respectively. Note the abundance of the full methylation state in WT and its absence in ΔAMT1 cells. (C) Demarcation of the four methylation states of ApT duplexes in WT (left) and ΔAMT1 cells (right) by their IPDr on W and C, respectively. (Left) For bulk ApT duplexes, the IPDr threshold for 6mA calling was set at 2.38, according to deconvolution based on Gaussian fitting of the small 6mA peak. For ApT duplexes with one 6mA as defined above, the IPDr threshold for calling 6mA on the opposite strand was set at 1.57, according to deconvolution based on Gaussian fitting of the small unmodified A peak. (Right) For bulk ApT duplexes, the IPDr threshold for 6mA calling was set at 2.55, according to deconvolution based on Gaussian fitting of the small 6mA peak. For ApT duplexes with one 6mA as defined above, the IPDr threshold for calling 6mA on the opposite strand was also set at 2.55, according to deconvolution based on Gaussian fitting of the small 6mA peak. (D) Typical DNA molecules from Tetrahymena WT (top) and ΔAMT1 cells (bottom). Note ApT duplexes with distinct methylation states (colored dots) distributed along individual DNA molecules (gray line). A DNA molecule with strong segregation strand bias in WT cells and a genomic position with strong penetrance strand bias in ΔAMT1 cells were marked.


