
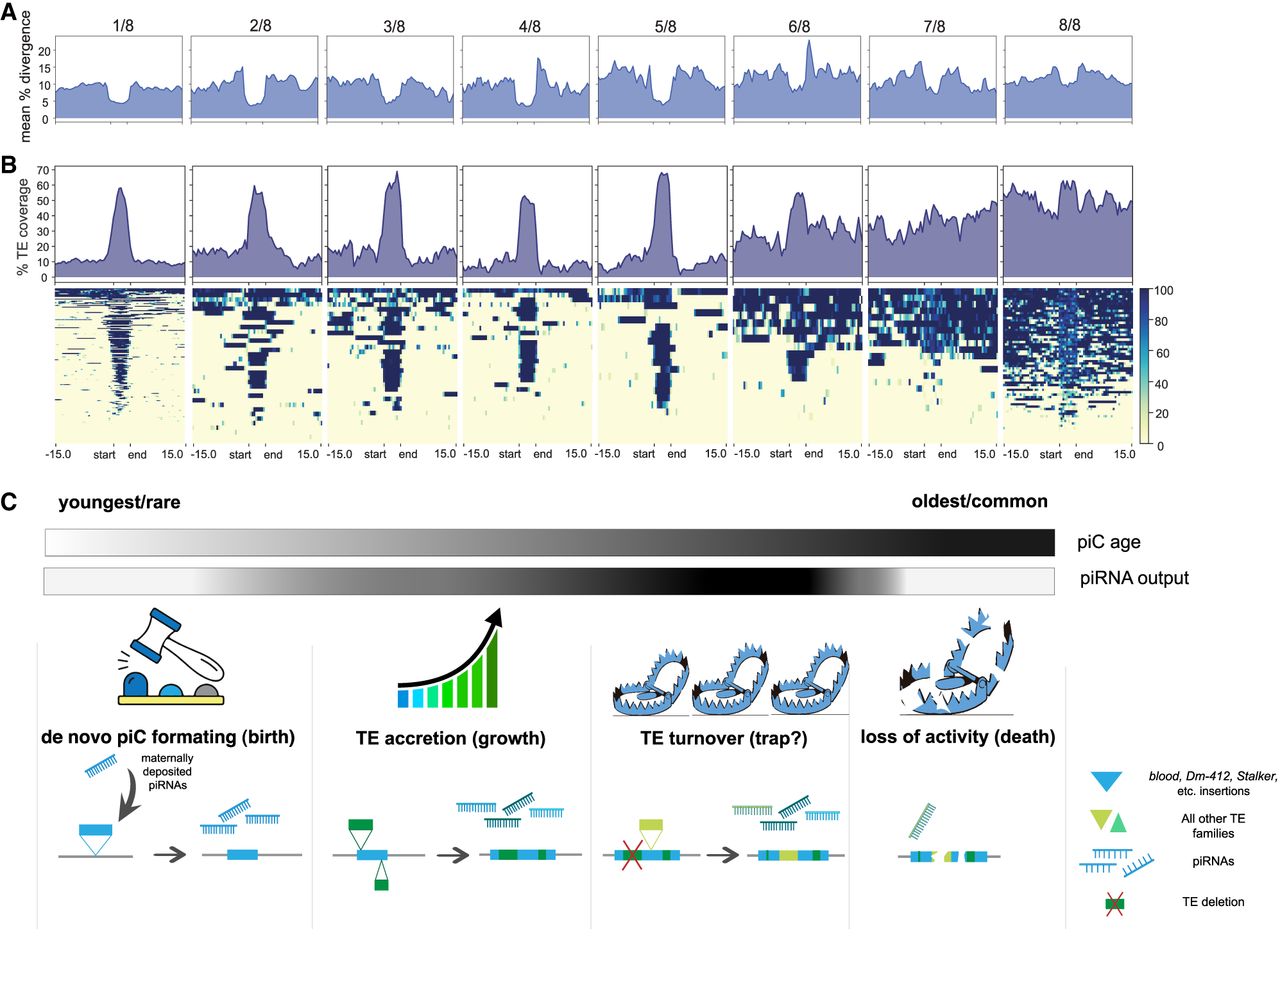
Age and distribution of TEs provide a portrait of intraspecific piC evolution. (A) TE age (by percentage of divergence) is plotted for piCs of increasing population frequency from left to right. Summary profile plot of mean percentage of TE insertion divergence in 500-bp windows in scaled piC regions and flanking non-piC regions of the reference genome. Each group represents piCs that are shared by 1/8 to 8/8 strains. (B) TE content of piCs of different stages are plotted. Summary profile plot and heatmap of mean TE coverage in 500-bp windows in scaled piC regions and flanking ±15-kb non-piC regions of the reference genome. Scaled piC regions are marked by start and end labels at the bottom of the heatmap. (C) New unified model of piC evolution: “Birth and death” is shown in four steps from left to right.


