
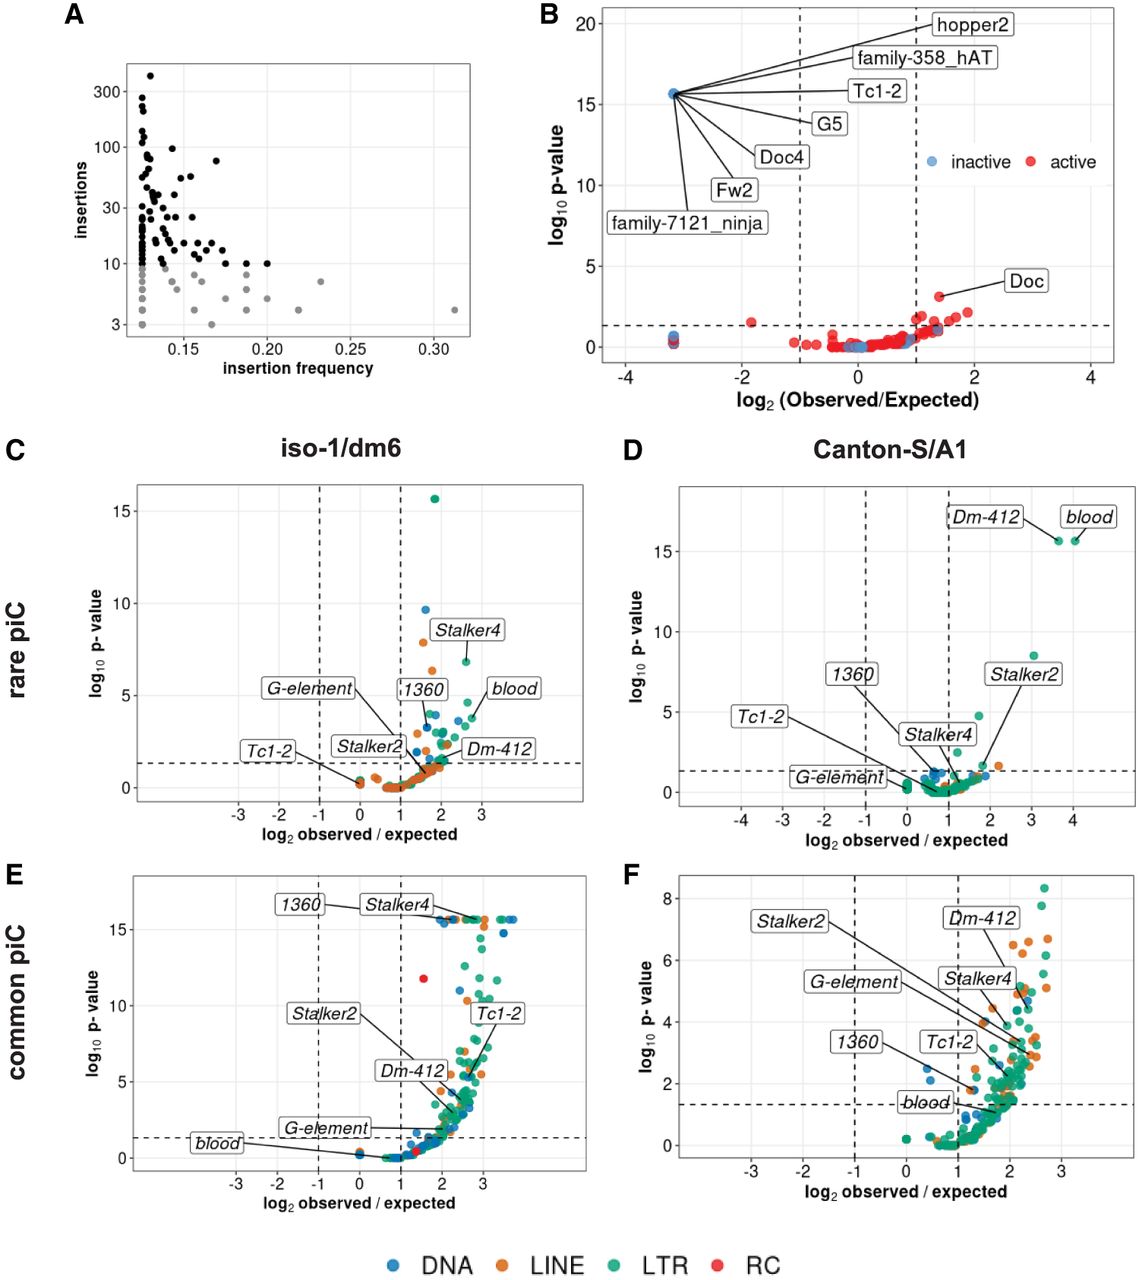
Insertions of only a few active LTR families associates with rare piCs. (A) Scatter plot of nonreference TE insertion counts and mean population frequencies of 176 TE families. Black dots highlight selected TEs classified as “active,” whereas gray dots are deemed “inactive.” (B) Enrichment analyses of nonreference insertions of TE families in master-list piCs using random shuffling of nonreference TE insertions. The y-axis P-values are from binomial tests conducted to compare observed counts to expected average overlaps of nonreference TE insertions to piCs for each family. (C–F) Enrichment analyses of TE families in master-list rare and common piCs of the A1/Can-S strain using random shuffling. All TE insertions (>200 bp) of strain iso-1 genome are randomly shuffled with constant piCs coordinates grouped into rare (shared by four strains or fewer) and common piCs (shared by five strains or more). P-values on y-axes are from binomial tests conducted to compare observed counts to expected average overlaps of TE insertions to piCs for each family. Statistically significant families are labeled.


