
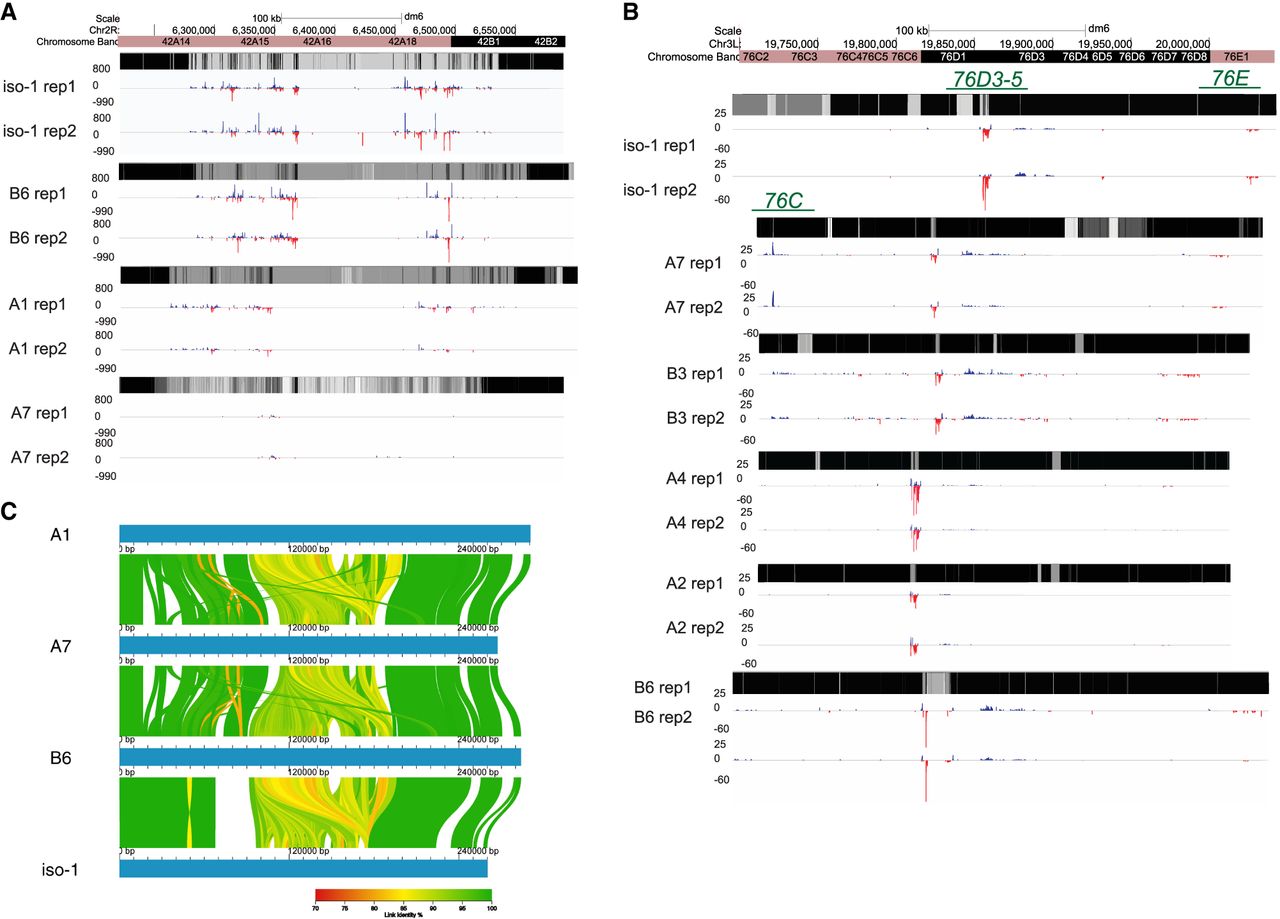
Natural variation in expression of uniquely mapping piRNAs from 42AB, 76C, and 76D. (A) Uniquely mapping piRNA abundance profiles of 42AB piCs for the four trains with two small RNA library replicates. The y-axis values are piRNA reads for 100-bp bins per million miRNA reads. Mappability scores (0–1) are shown for 100-bp bins of each respective 42AB genomic assembly in the heatmap. (B) Uniquely mapping piRNA expression profile of 76C, 76D, and 76E piCs for the six strains with two small RNA library replicates. The y-axis values are piRNA reads for 100-bp bins per million miRNA reads. Mappability scores (0–1) are shown for 100-bp bins of each respective 76C, 76D, and 76E genomic assembly in the heatmap. (C) Ribbon plot of multiple-sequence alignment for 42AB assembly in four strains. Only alignments of >80% identity and >1 kb in length are shown.


