
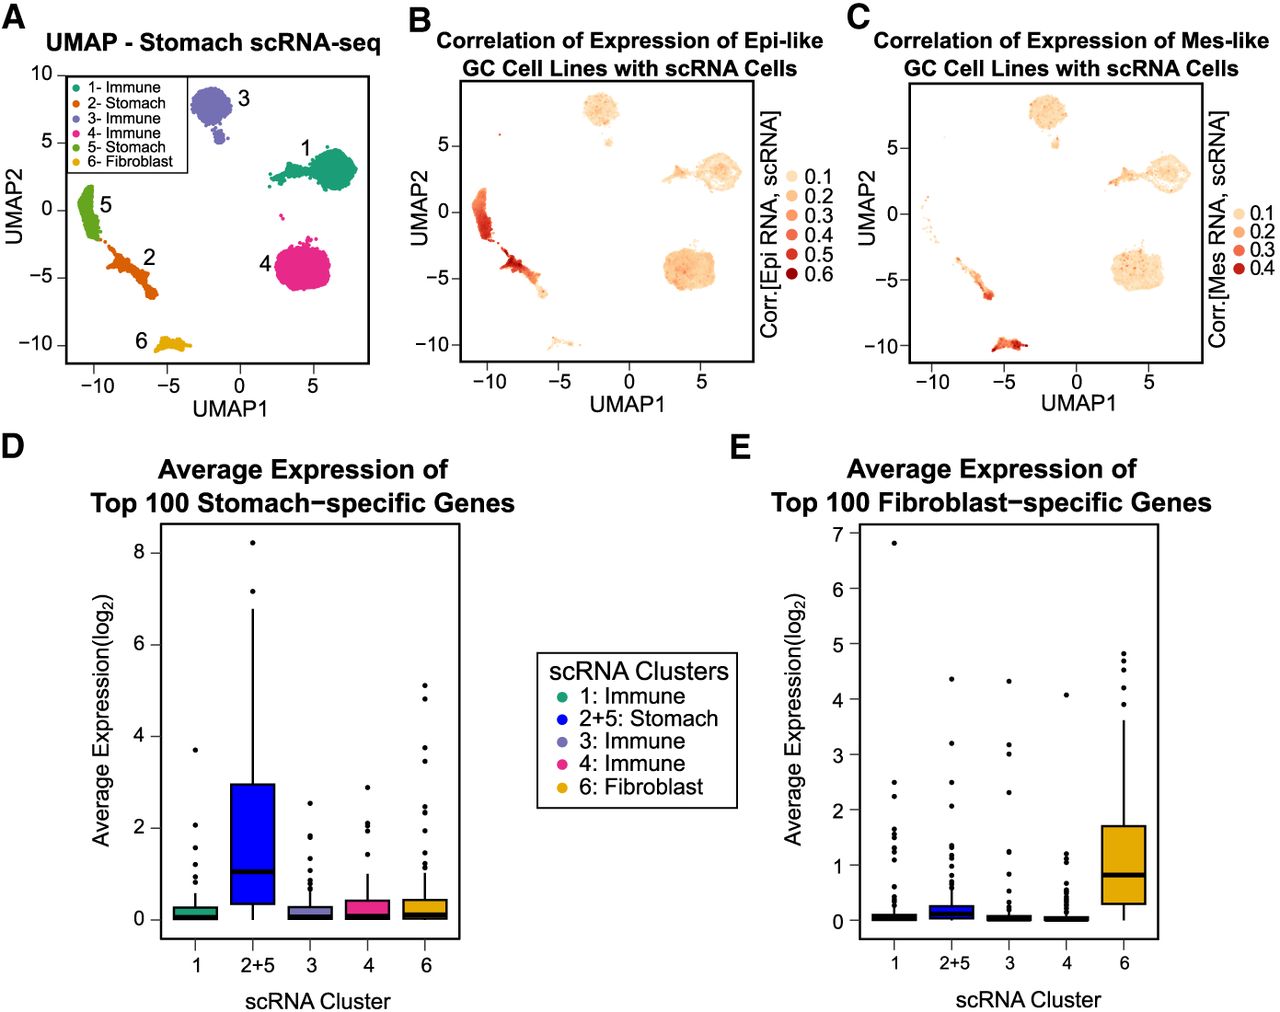
Mes-like GC is most similar in expression profile to the single-cell fibroblast population of both tumor and normal stomach tissue. (A) UMAP of scRNA-seq of gastric tumor and adjacent normal stomach tissue from Kim et al. (2022). Six cell populations are detected; populations 2 and 5 are stomach, and 6 is fibroblast. (B) Epi-like cell line gene expression profiles are most highly correlated with the stomach clusters 2 and 5. (C) Mes-like gene expression profiles are most highly correlated with the fibroblast cluster, cluster 6. (D) Highly expressed stomach-specific genes are expressed only in stomach clusters 2 and 5, combined owing to similarity (t-test P < 10−8 for cluster 2 + 5 vs. other clusters). (E) Highly expressed fibroblast-specific genes are expressed only in fibroblast cluster 6 (t-test P < 10−9 for cluster 6 vs. other clusters).


