
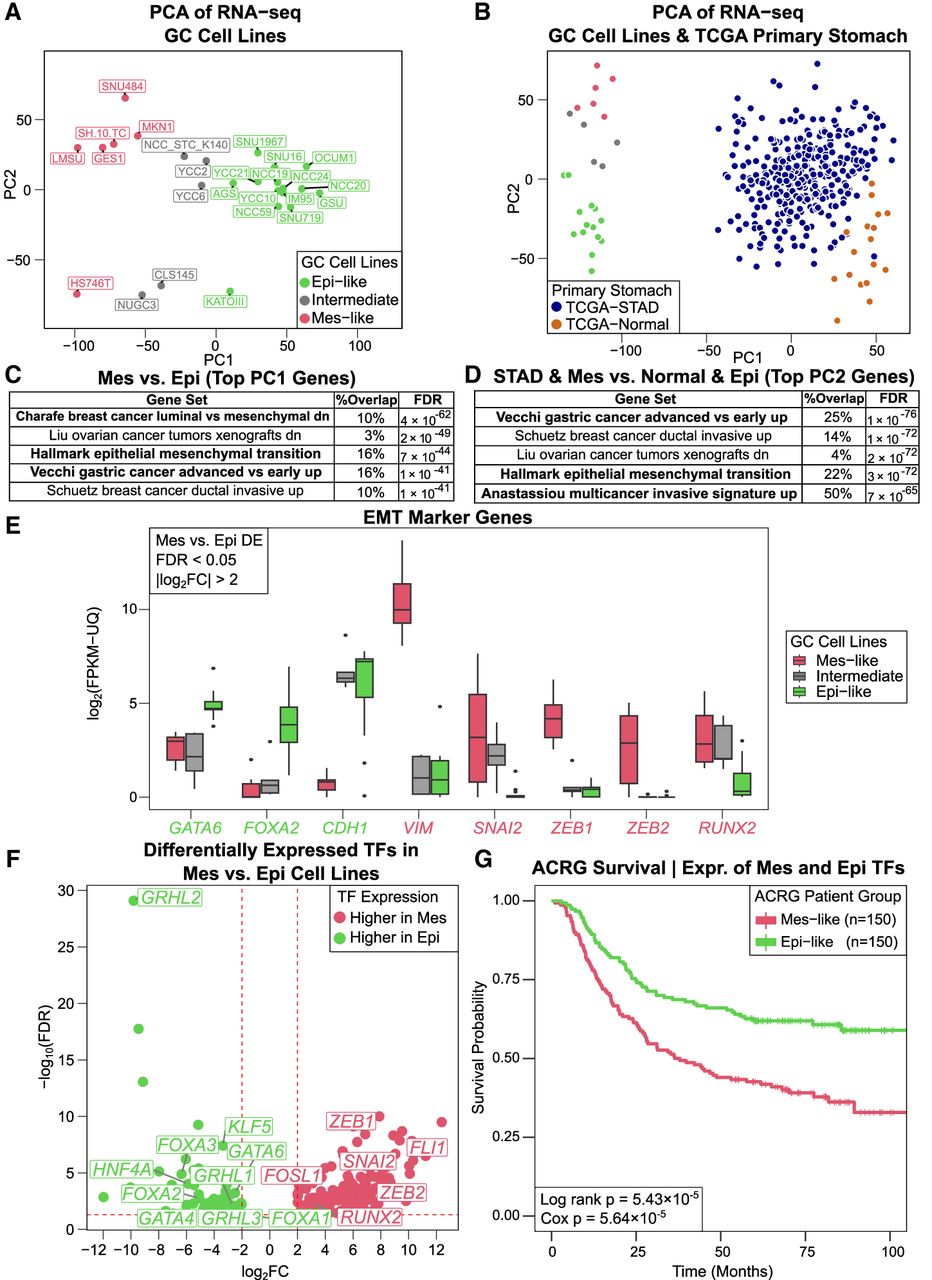
RNA-seq expression of GC cell lines is concordant with EMT and advanced-versus-early GC expression signatures and is consistent with TF activity inferred from chromatin accessibility. (A) PCA of gene expression profiles is consistent with PCA from ATAC-seq. (B) Combined PCA of GC cell lines with TCGA-STAD (tumor) and TCGA-normal shows shared variation between Mes-like versus Epi-like and tumor versus normal. (C,D) The genes explaining the variation (top 100 PCA gene weights) in the direction of PC1 (A) and PC2 (B) both are most enriched for genes highly expressed in EMT and advanced-versus-early GC. (E) Examples of marker gene expression for EMT in cancer (higher in Mes, red; higher in Epi, green), with likelihood ratio test, FDR < 0.05, and |log2FC| > 2. (F) Differentially expressed (DE) TFs between the Mes-like and Epi-like GC cell lines, with a likelihood ratio test FDR < 0.05 and |log2FC| > 2. (G) Survival analysis based on the expression of Mes and Epi DE TFs in the ACRG cohort.


