
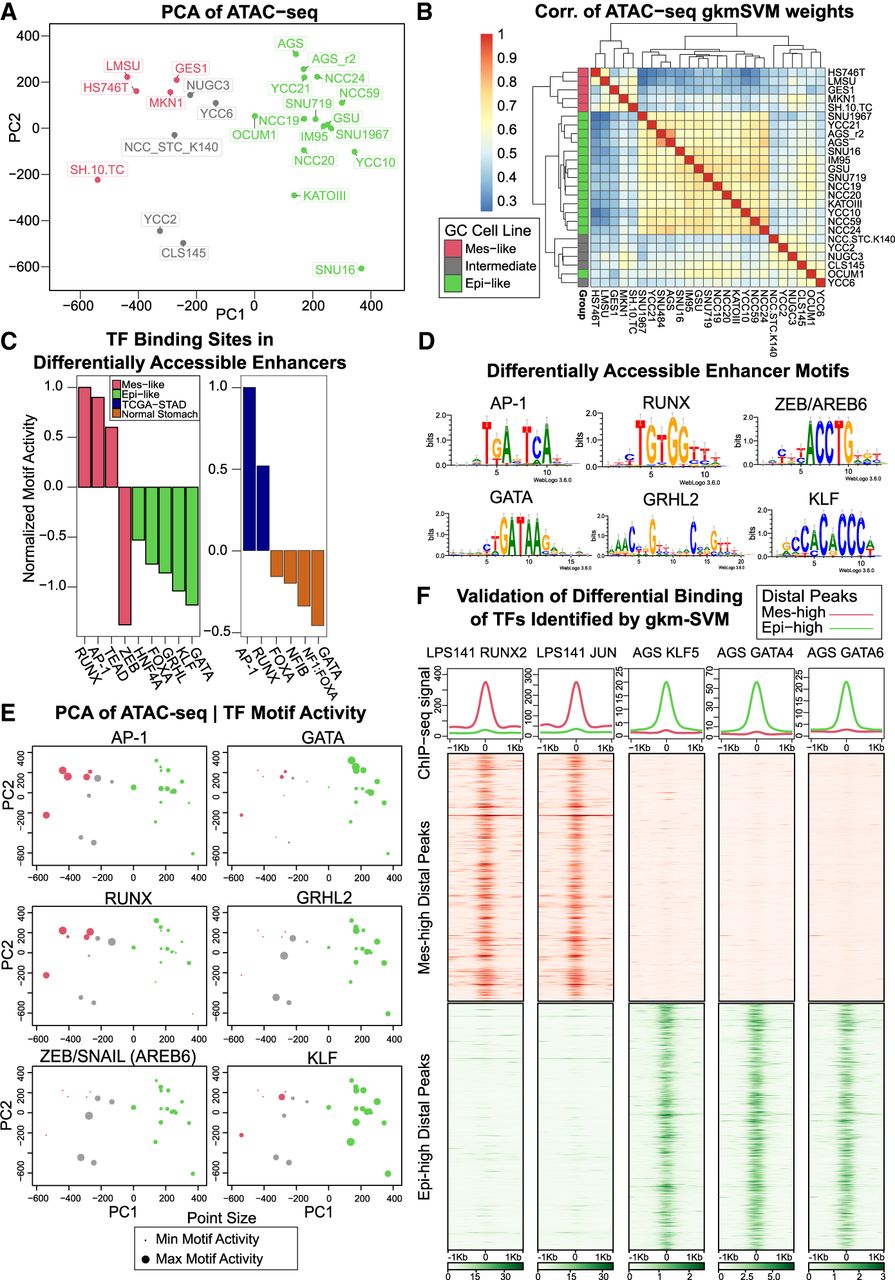
Variation in the chromatin accessibility profiles across GC cell lines is consistent with differential TF activity inferred from sequence-based machine learning. (A) PCA of ATAC-seq detects variable accessibility clustered roughly into three groups of GC cell lines (Mes-like, Intermediate, Epi-like). (B) gkm-SVM training produces similar weight vectors in the Mes-like, Intermediate, and Epi-like GC cell lines, resulting from the activation of similar sets of TFs. (C) Training gkm-SVM on differentially active peaks detects RUNX, AP-1, and TEAD activation in Mes-like peaks and detects KLF, GATA, GRHL, FOXA, and HNF4A activation in Epi-like peaks. Similar TF activation is detected when training on a primary GC tumor (TCGA-STAD) versus normal stomach. ZEB is a transcriptional repressor, and the absence of its motif from open-chromatin regions shows its activity and, hence, the flipped sign (red color) for ZEB activity score. (D) TFBS PWM logos. (E) gkm-SVM inferred activity (dot size) of these TFs across all samples detects common patterns of activation but additional heterogeneity within each group. (F) ChIP-seq validation experiments show that RUNX2 and AP-1 bind to Mes-high distal peaks and do not bind to Epi-high peaks in LPS141, consistent with the machine learning predictions of RUNX and AP-1 activity. On the other hand, GATA4, GATA6, and KLF5 bind to Epi-high peaks and do not bind to Mes-high peaks in AGS. AGS is one of the Epi-like GC cell lines, and LPS141 is a mesenchymal liposarcoma cell line with a very similar transcriptional profile to Mes-like GC cell lines (see Supplemental Fig. S6).


