
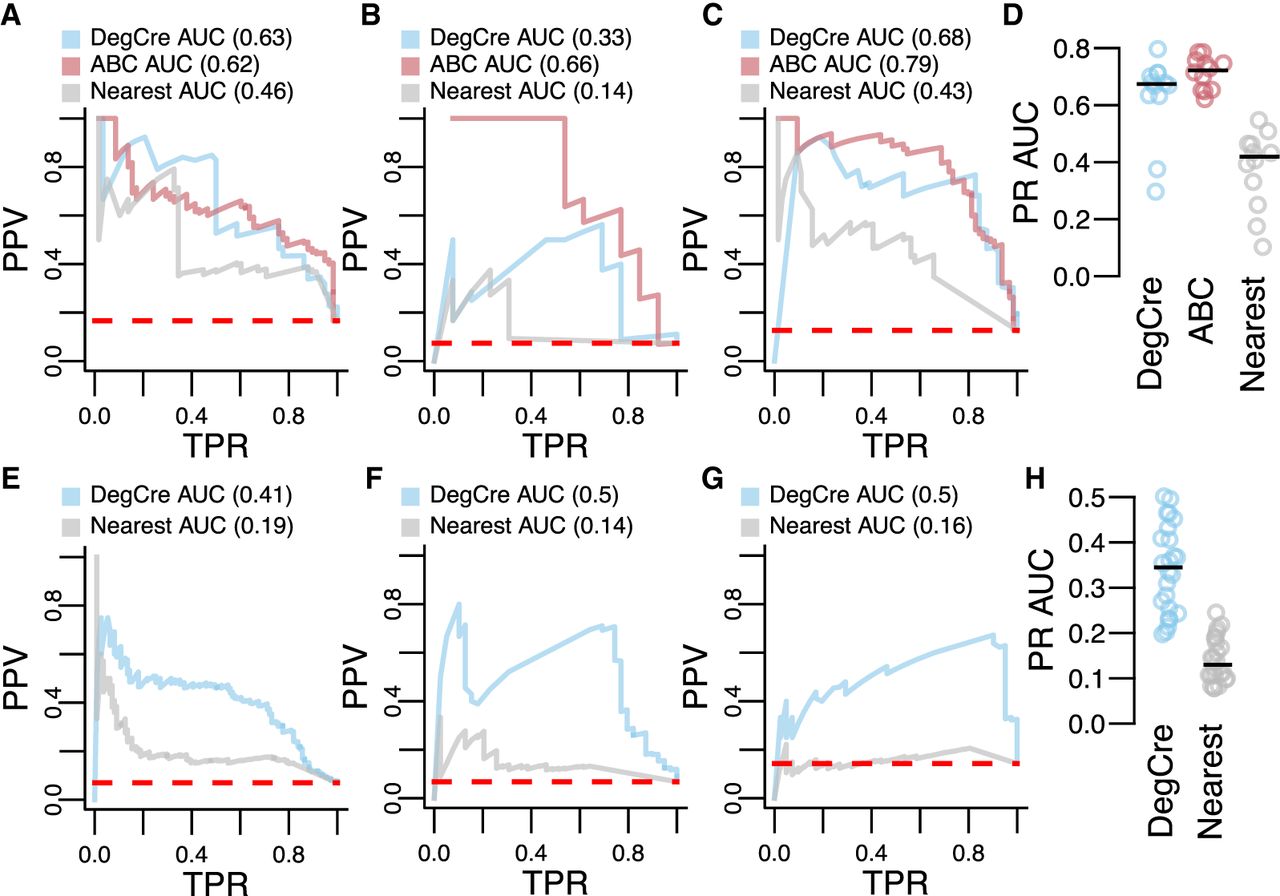
Evaluation of DegCre associations with CRISPR perturbations. (A–C) Precision-recall (PR) plots are presented with CRISPR data from Nasser et al. as the standard. (PPV) Positive predictive value (precision), (TPR) true-positive rate (recall). Dashed red line indicates “zero skill” performance. Predictions based on DegCre and ABC are shown in the indicated colors. A model in which a CRE is assigned to the nearest DEG (passing adjusted P-value cutoff), “nearest,” is shown in gray. DegCre and nearest predictions are based on data from Reed et al. H3K27ac ChIP-seq at 2 h (A), Savic et al. H3K27ac ChIP-seq at 48 h (B), and Reed et al. ATAC-seq at 2 h (C). (D) PR areas under curve (AUCs) are shown for each method for all data sets with greater than or equal to 25 associations positive by CRISPR. (E–G) PR plots are presented with CRISPR data from Gasperini et al. as the standard with same conventions as A–C. Predictions are based on data from Reed et al. H3K27ac ChIP-seq at 2 h (E), Sanchez-Priego et al. H3K27ac Cut and Run from H1 GABA late (F), and Hiatt et al. ZMYM3 CETCh-seq with R1274W variant using anticorrelated analysis (G). (H) Same as D but for Gasperini et al. data.


