
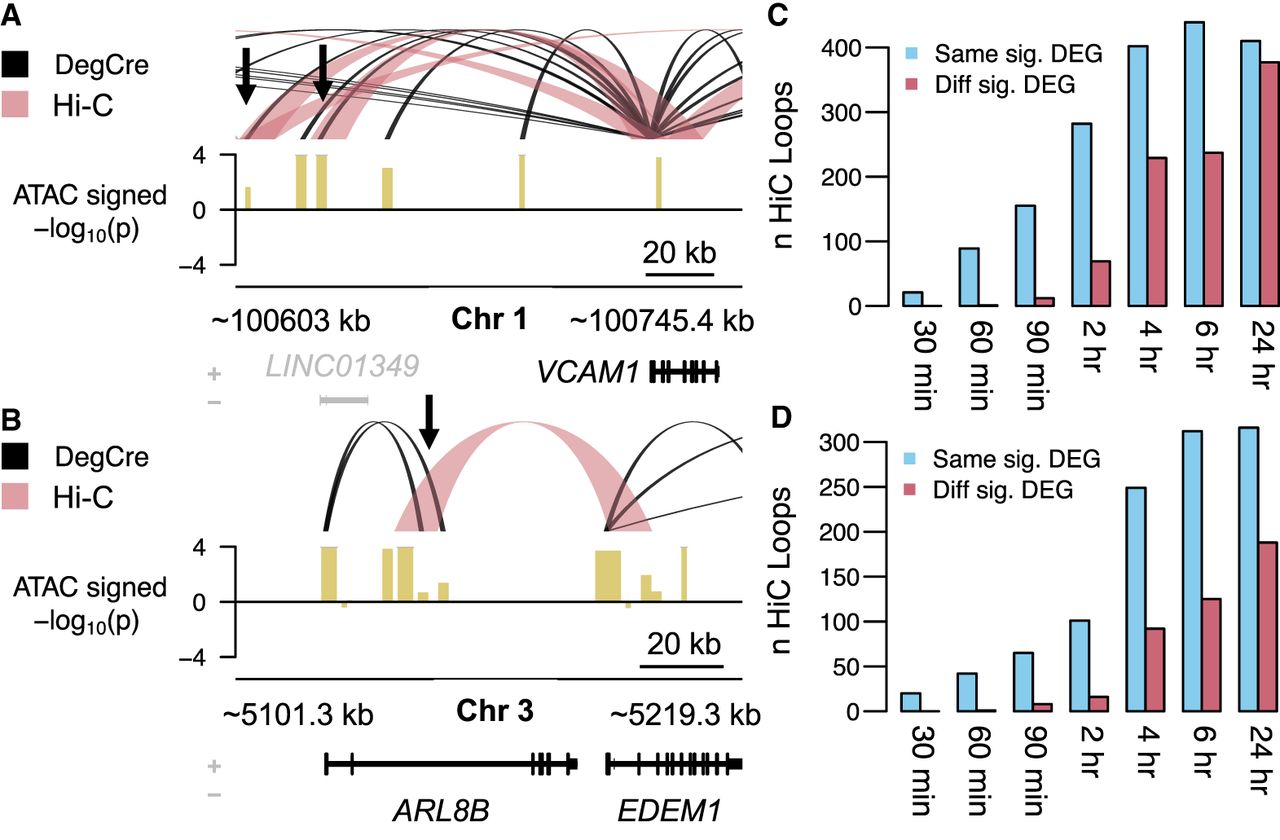
Comparison of DegCre associations to Hi-C loops. (A) For ATAC-seq data from Reed et al. at the 120-min time point, DegCre associations with an FDR ≤ 0.05 and an association distance >20 kb are shown in black. Hi-C loops with an FDR ≤ 0.05 and a loop distance <1 Mb are shown in light red. Gene names in black indicate significant differential expression. Black arrows indicate distal CREs that both DegCre and Hi-C link to the VCAM1 TSS. The signal track (yellow) shows the −log10 of the differential ATAC signal multiplied by the sign of the log fold-change. (B) Same plotting conventions as A but the black arrow indicates a group of CREs for which DegCre and Hi-C assign the TSSs of different significant DEGs. (C) For ATAC-seq data, the blue bars indicate the number of Hi-C loops that have one anchor in a CRE with a significant (FDR < 0.05) DegCre association and that link to the TSS of the same DEG as the DegCre association. Red bars indicate the number of Hi-C loops that have one anchor in a CRE with a significant DegCre association and that link to the TSS of a different DEG from the DegCre association. (D) Same plotting conventions as C but for H3K27ac ChIP-seq data.


