
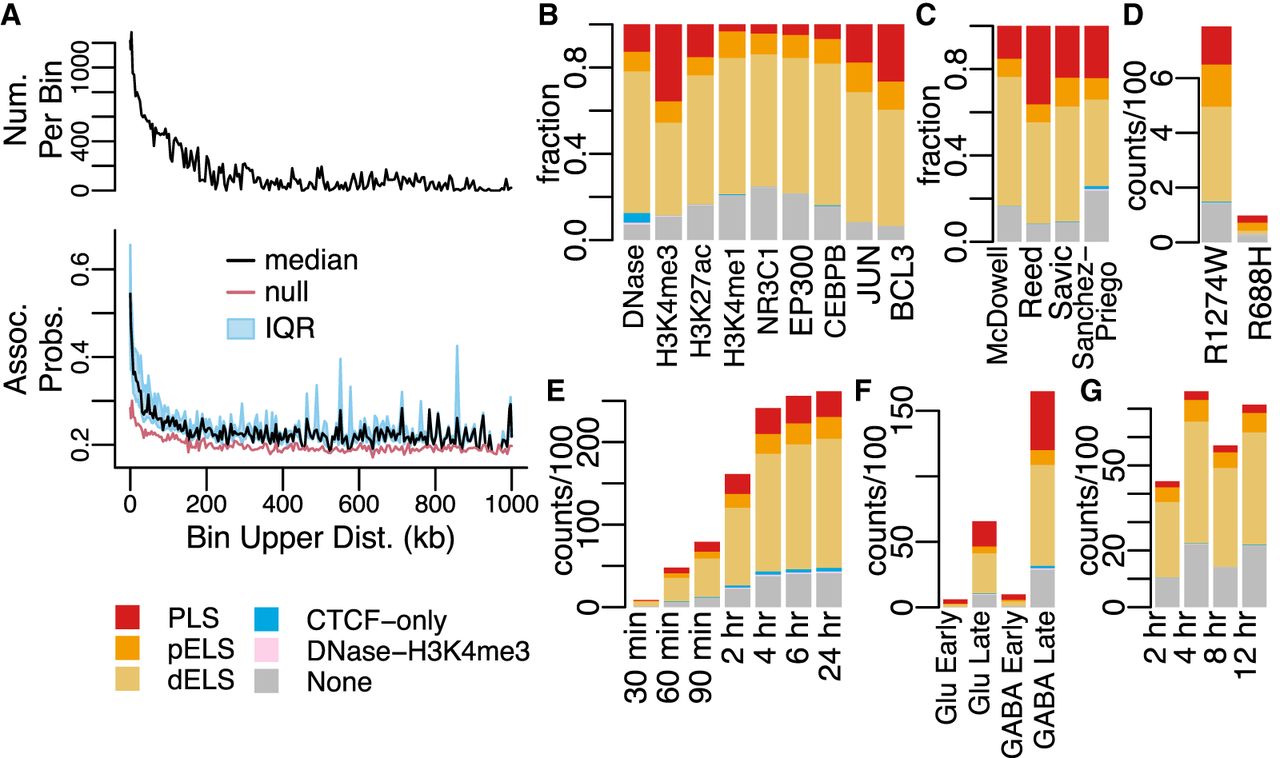
Characteristics of DegCre associations. (A) The black line in the upper panel half displays the number of DegCre associations per bin that pass FDR less than 0.05. The bottom panel displays the per bin DegCre association probability. The common x-axis shows for each bin the association distance from TSS to CRE. Each bin comprises a range of distances with the upper bound of that range plotted here. The black line indicates the median value for each bin, and the blue region indicates the interquartile range (IQR). The red line shows the per bin probability considering only the bin distance, used as the null in the DegCre FDR calculation (Methods). DegCre associations are shown from the ATAC-seq data at 2 h from Reed et al. (B–G) Bars show the counts or fractions of ENCODE cCRE annotation overlaps for tested CREs having at least one significant (FDR less than 0.05) DegCre association. (B) Fractions are from McDowell et al. at 8 h for the indicated data types. (C) Fractions are shown for H3K27ac ChIP-seq data from McDowell et al. at 8 h, Reed et al. at 2 h, Savic et al. at 24 h, and Sanchez-Priego et al. (Cut and Run) from the H1 GABA late time point. (D) Counts for ZMYM3 CETCh-seq (discordant associations) from Hiatt et al. R1274W is a likely pathogenic mutation, and R688H is likely benign. (E–G) Counts of associations by time point are shown for ATAC-seq data from Reed et al. (E), ATAC-seq data from Sanchez-Priego et al. (F), and NR3C1 ChIP-seq data from McDowell et al. (G). Abbreviations for ENCODE cCREs are as follows: (PLS) promoter like sequence, (pELS) proximal enhancer-like sequence, and (dELS) distal enhancer like sequence.


