
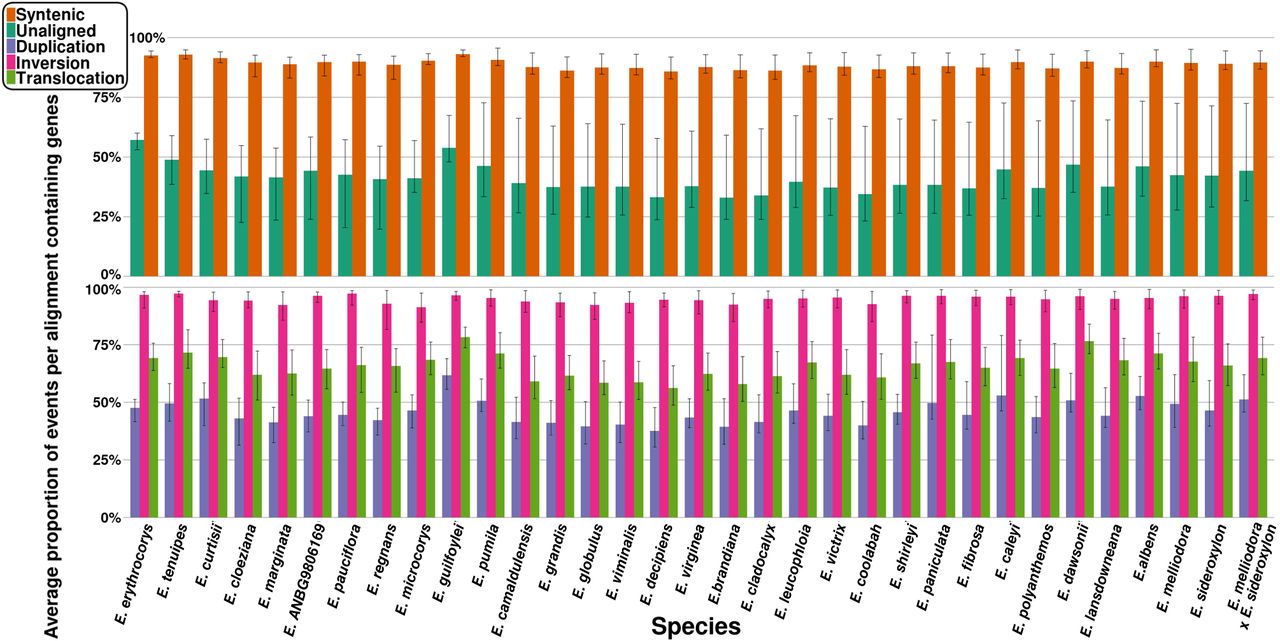
Figure 6.
Average proportion of genic events for each species genome. The proportion of genic events was calculated for each pairwise alignment and was averaged. Error bars indicate the minimum and maximum proportion of genic events found when aligned to all other genomes.


