
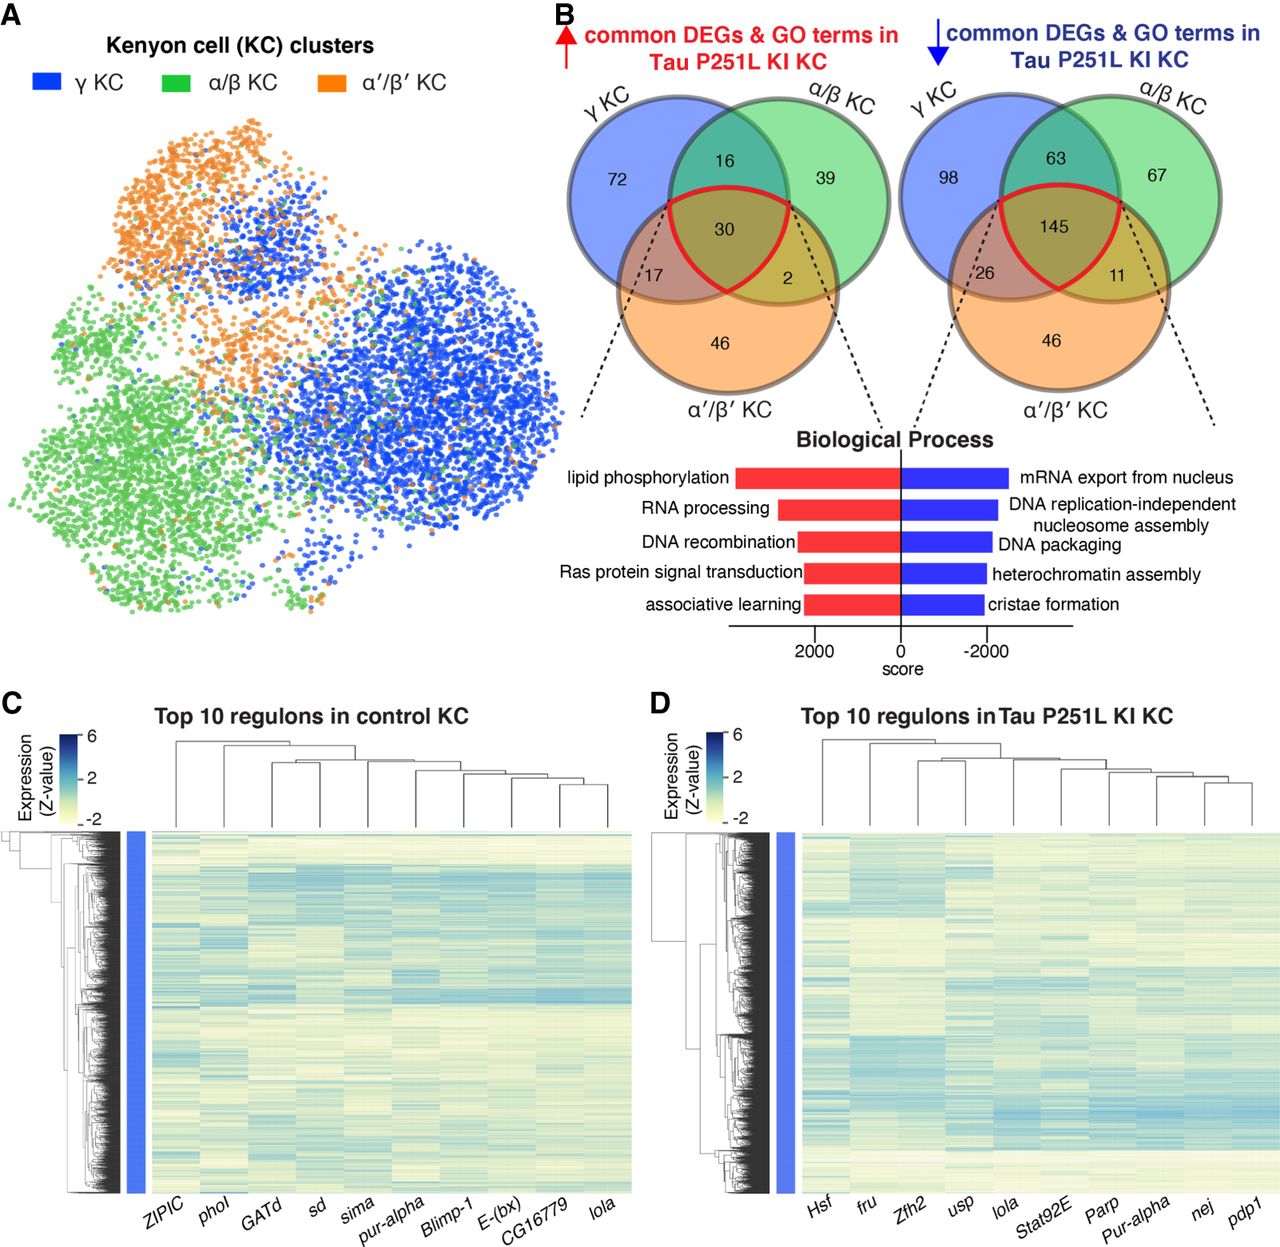
Figure 8.
Gene expression and regulatory networks in Kenyon cells (KCs). (A,B) Three KC clusters—gamma-KC, alpha/beta-KC, and alpha′/beta′-KC—and biological process based on the common up-regulated and down-regulated genes in KC clusters in Tau P251L knock-in brains. Score represents the combined score c = log(p) × z (Chen et al. 2013). Control and Tau P251L knock-in Kenyon cells were clustered separately using SCENIC gene regulatory network analysis to identify regulons. (C,D) The top 10 regulons identified by SCENIC gene regulatory network analysis in control (C) and Tau P251L knock-in (D) KCs are presented in the heatmaps. Each row represents a KC; each column is a regulon.


