
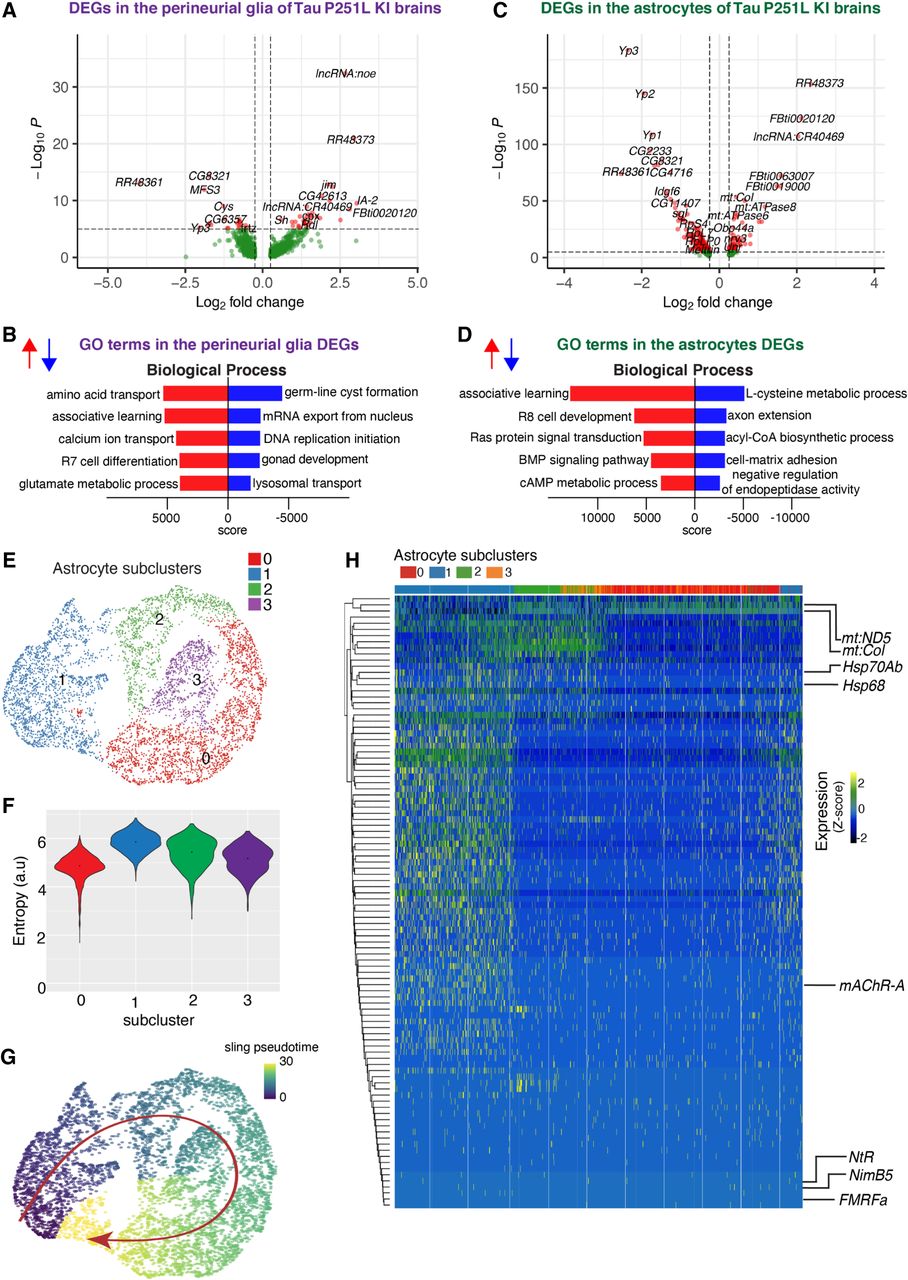
Gene expression and trajectory analysis in glia. (A) Differentially regulated genes, both up-regulated and down-regulated, in perineurial glia of Tau P251L knock-in brains compared with controls. (B) GO analysis shows biological processes associated with the up-regulated and down-regulated genes in perineurial glia from Tau P251L knock-in brains compared with controls. (C) Differentially regulated genes, both up-regulated and down-regulated, in astrocytes of Tau P251L knock-in brains compared with controls. (D) GO analysis shows biological process associated with up-regulated and down-regulated genes in astrocytes of Tau P251L knock-in brains. All dots on the volcano plots are significant at FDR < 0.05 and log2FC > 0.25 for up-regulated and log2FC< −0.25 for down-regulated genes. Score represents the combined score c = log(p) × z (Chen et al. 2013). Astrocytes from both control and Tau P251L knock-in brains were further subclustered into four groups. (E,F) Entropy analysis to define the root for trajectory analysis revealed cluster 1 to have the highest entropy. (G) Slingshot trajectory analysis on astrocyte clusters identified a single lineage passing sequentially from clusters 1 to 2, 3, and 0. (H) Differential gene expression between astrocyte subclusters adjacent in pseudotime were used to cluster genes along the pseudotime trajectory. Each row in the heat map represents a gene. The columns are astrocyte subclusters arranged according to pseudotime from left to right. Examples of differentially regulated genes from enriched GO biological processes are shown on the calculated trajectory.


