
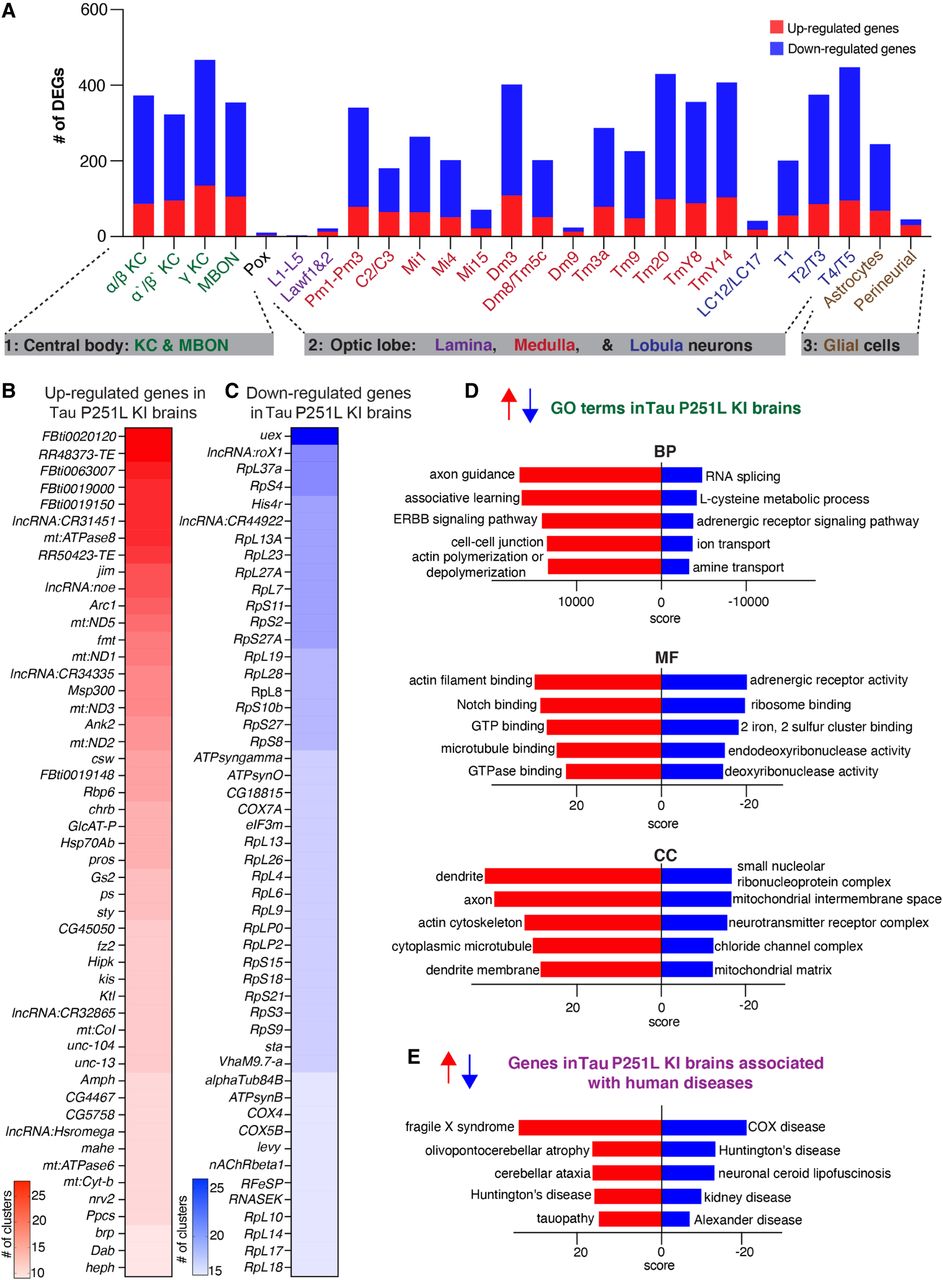
Differential gene expression and enrichment analysis of the scRNA-seq data set in Tau P251L knock-in brains compared with controls. (A) The number of differentially expressed genes (DEGs), both up-regulated and down-regulated genes, in all the annotated clusters of Tau P251L knock-in brains compared with controls. Results are displayed across three major anatomic and functional classes of cells: (1) central body containing three clusters of Kenyon cells (KCs), mushroom body output neurons (MBONs) and pox neurons; (2) optic lobe neurons containing lamina, medullary, and lobula neurons clusters; and (3) glia cells containing astrocytes and perineurial clusters. (B,C) Heatmaps of the top 50 up-regulated (B) and down-regulated (C) genes in all the clusters of Tau P251L knock-in brains compared with controls (Supplemental Table S3). (D) Gene Ontology (GO) enrichment analysis identified top up-regulated and down-regulated biological processes (BPs), molecular functions (MFs), and cellular components (CCs). (E) Analysis of human disease–associated genes revealed top up-regulated and down-regulated disease-associated gene sets. Score represents the combined score c = log(p) × z (Chen et al. 2013).


