
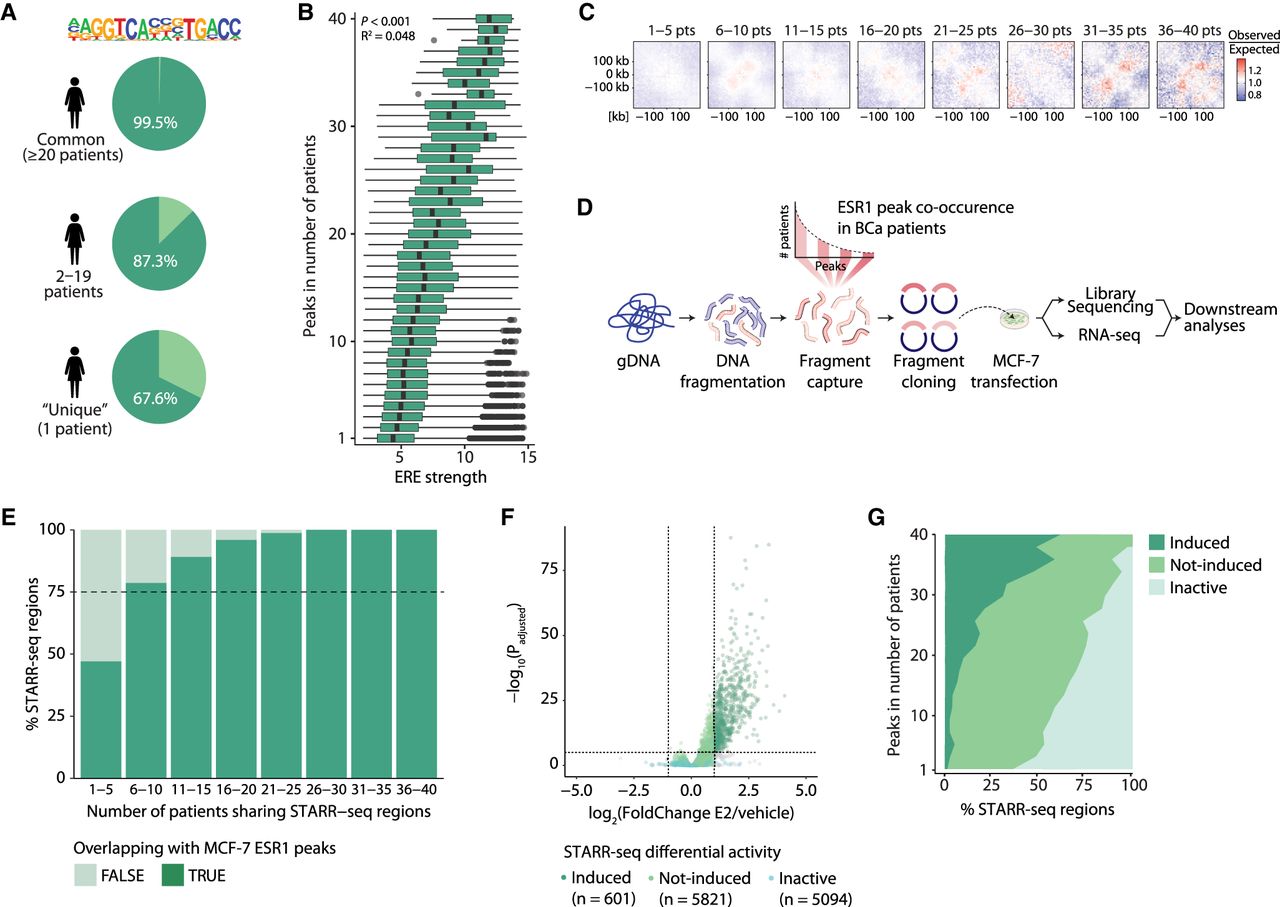
Common ESR1 peaks are associated with stronger ERE motif, increased chromatin interactions, and higher enhancer activity. (A) The percentage of common, less common, and patient-unique ESR1 peaks in females that contain an estrogen response element (ERE). (B) The strength of those EREs as determined by HOMER, ranked from those in common to those in more patient-unique ESR1 peaks. Black dots represent outliers. (C) Aggregate region analyses (ARAs) showing the average Hi-C contacts (observed over expected scores) at ESR1 binding sites shared by an increasing number of patients from left to right. The matrices include a window of ±250 kb from the ESR1 peak centers. (D) Schematic overview of STARR-seq methodology. (E) Stacked bar plot showing the overlap between STARR-seq regions and MCF-7 ESR1 peaks (Ross-Innes et al. 2012) in bins of female patient STARR-seq shared regions. (F) Volcano plot of STARR-seq results in the cell line MCF-7 upon 6 h of 10 nM estradiol (E2) stimulation. (G) Distribution of enhancer activity as determined by STARR-seq upon 6 h of 10 nM estradiol stimulation, from common to more patient-unique peaks. Details on cutoffs for categories induced, not-induced, and inactive are described in the Methods section.


