
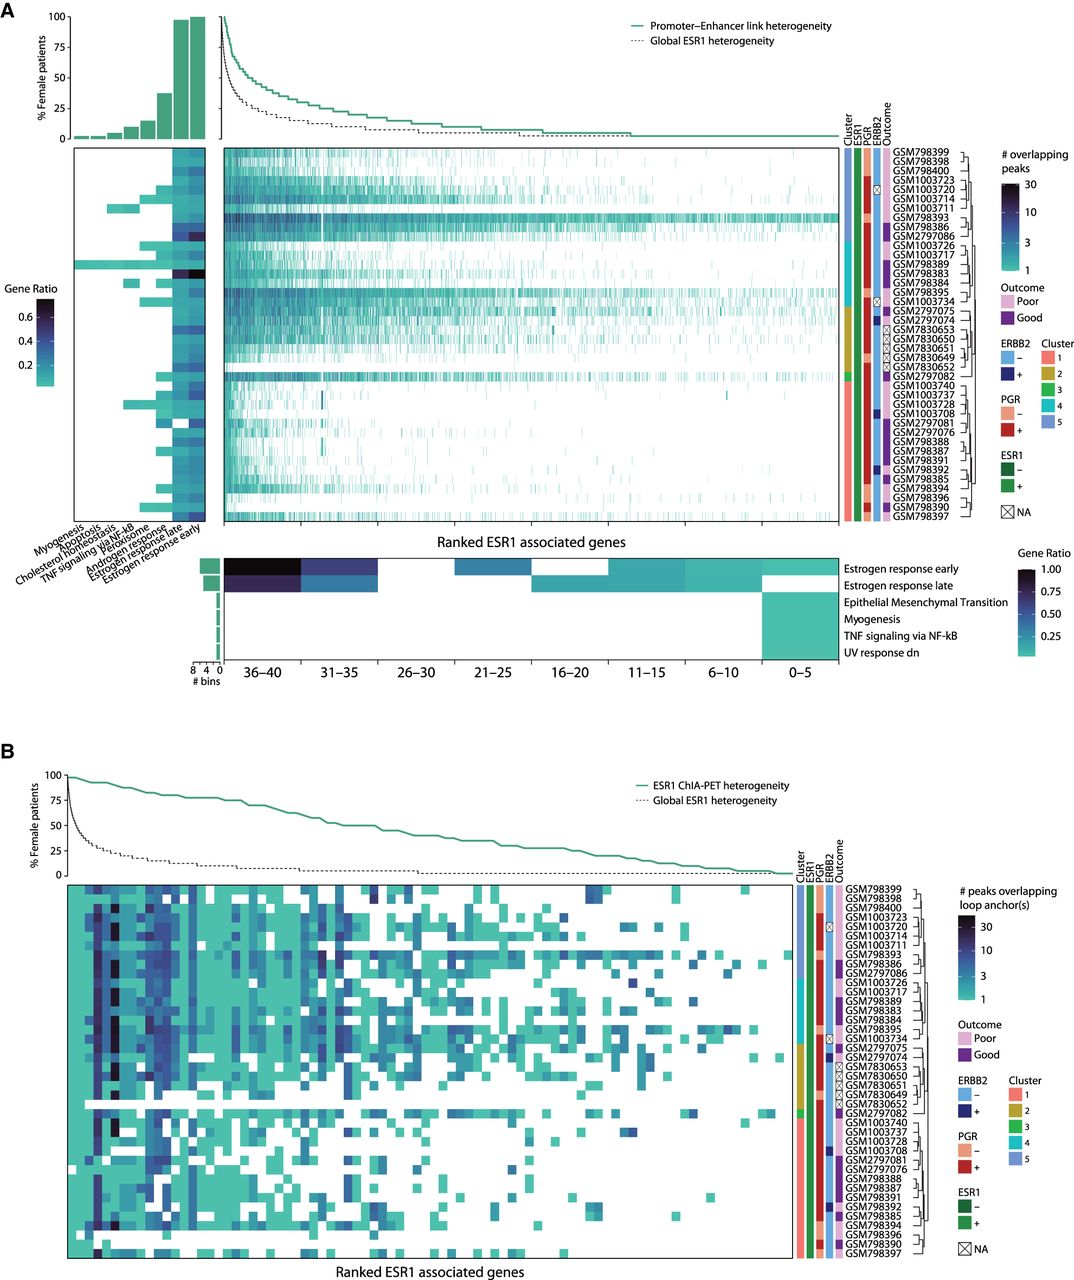
ESR1 female peaks converge to redundant enhancers regulating estrogen response genes. (A) Heatmap shows the number of ESR1 peaks that are overlapping with a region associated to a gene (x-axis) (Corces et al. 2018) per each female patient (y-axis). Each gene is ranked by decreasing number of patients carrying ESR1 peaks associated to that specific gene. The number of patients sharing a gene is shown by the line above the heatmap. The global distribution of ESR1 peak conservation among samples is depicted by a black dashed line. Ranked genes are grouped in seven bins depending on the degree of coregulation among patients. For each bin, the statistically significantly enriched cancer hallmark gene sets are shown (bottom heatmap), and the bar plot on the bottom left shows the number of bins sharing a given hallmark. The left heatmap depicts the cancer hallmarks enriched in each patient; above this heatmap, a bar plot indicates the percentage of patients showing the enrichment of each hallmark. (B) Same heatmap as in A, but in this case, the gene associated is based on chromatin loops identified by ESR1 ChIA-PET in MCF-7 (Fullwood et al. 2009; The ENCODE Project Consortium 2012).


