
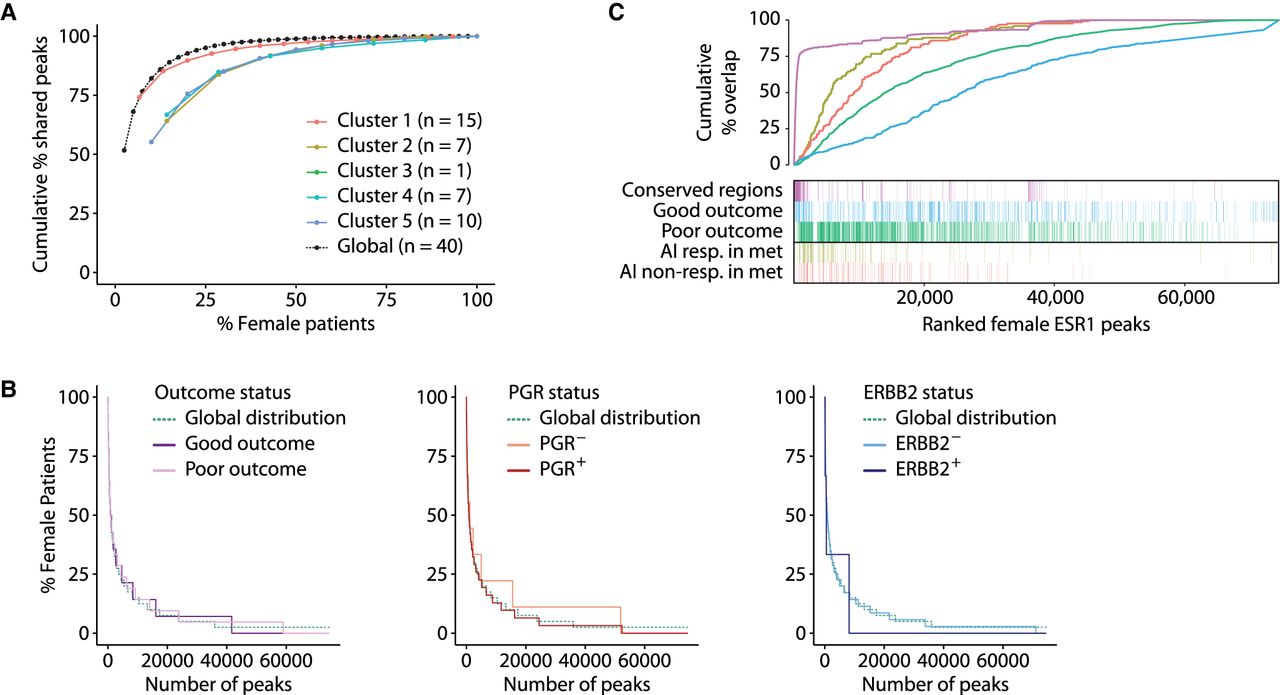
Figure 3.
ESR1 heterogeneity in female patients is not explained by molecular and clinical features. (A) Cumulative percentage of ESR1 peaks shared among female patients within the five clusters defined in Supplemental Figure S2A. (B) Percentage of female patients sharing ESR1 within groups of patients based on outcome, PGR, and ERBB2 status. The global distribution over all the peaks is depicted by a dashed green line. (C) Cumulative percentages and heatmap of the overlaps between ranked female ESR1 patients and good/poor outcome-associated (Ross-Innes et al. 2012) or aromatase inhibitor (AI) response–associated ESR1 peaks (Jansen et al. 2013).


