
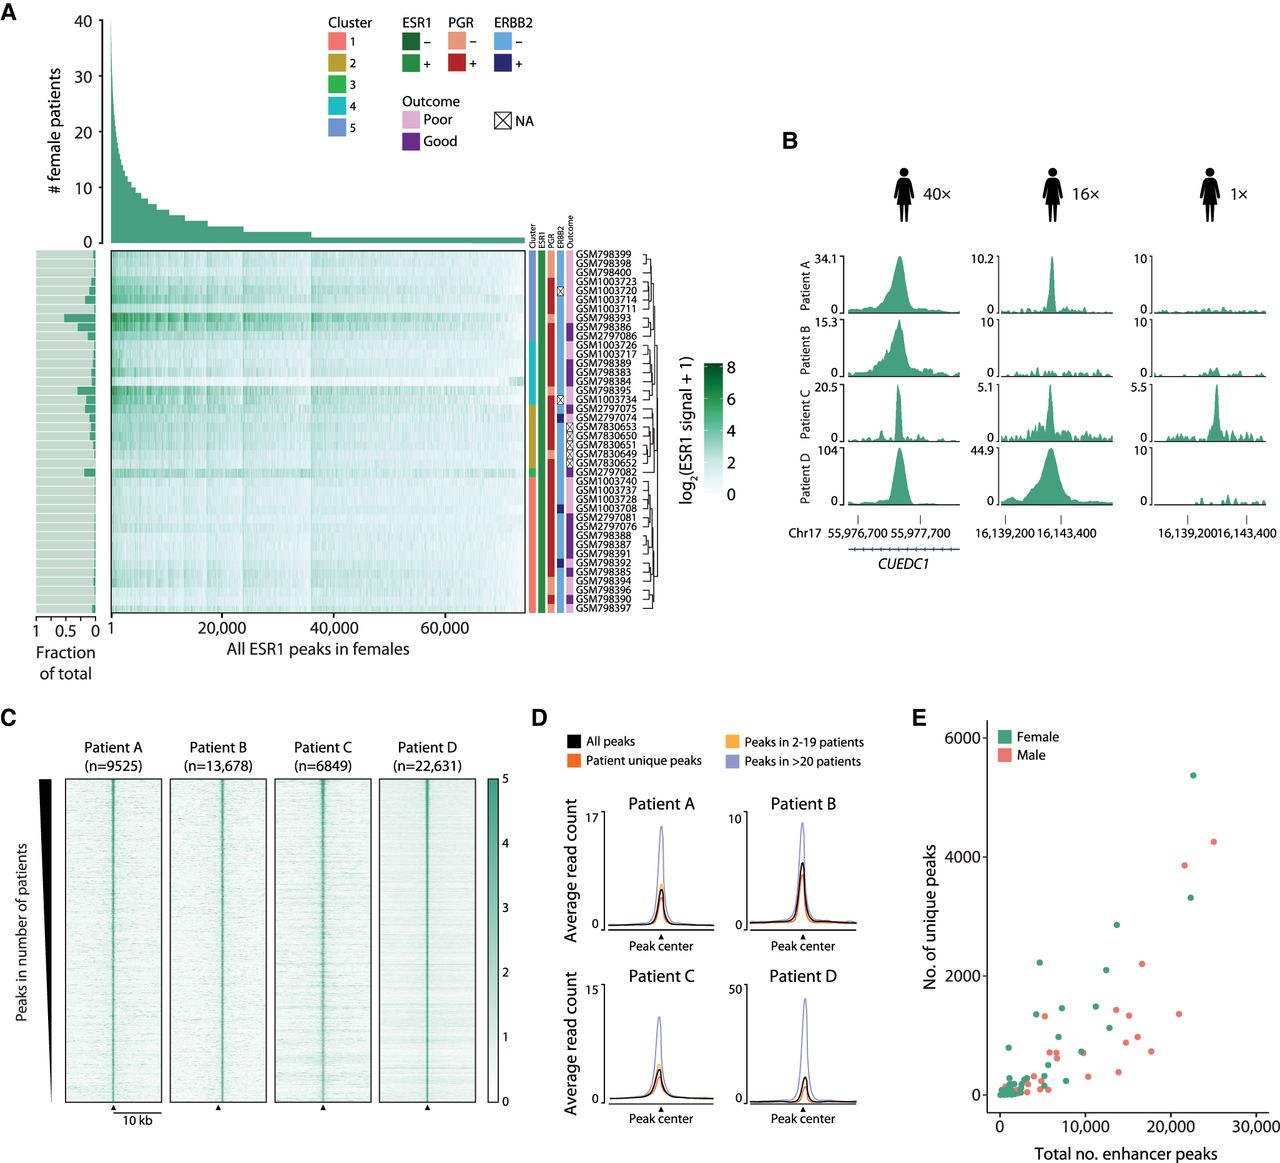
Characterization of enhancers ranked from commonly to less frequently bound by ESR1 shows distinct biological features. (A) A ranked overview of 74,438 distal ESR1 peaks showing in how many tumor samples each peak was found in a cohort of 40 female patients. Heatmap showing the average ESR1 ChIP-seq score at a specific peak for each sample. The bar plot (left) indicates the fraction of peaks found in each patient of the total peaks found. Clustering is based on the Pearson correlation at ESR1 peaks for the ESR1 ChIP-seq signal as defined in Supplemental Figure S2A. (B) Examples of ESR1 peaks that were peak-called in tumor samples in all 40 females (left), in 16 females (middle), and in only one female patient (right). (C) Examples of per-patient heatmaps of ESR1 signal, of peaks called in that female patient sample, ranked as in A. (D) For more commonly occurring and unique peaks, examples of the average intensity of ESR1 ChIP-seq signal in four female patients are shown. (E) Correlation plot of the total number of distal peaks in a patient sample (x-axis), versus the percentage of patient-unique peaks in that sample (y-axis).


