
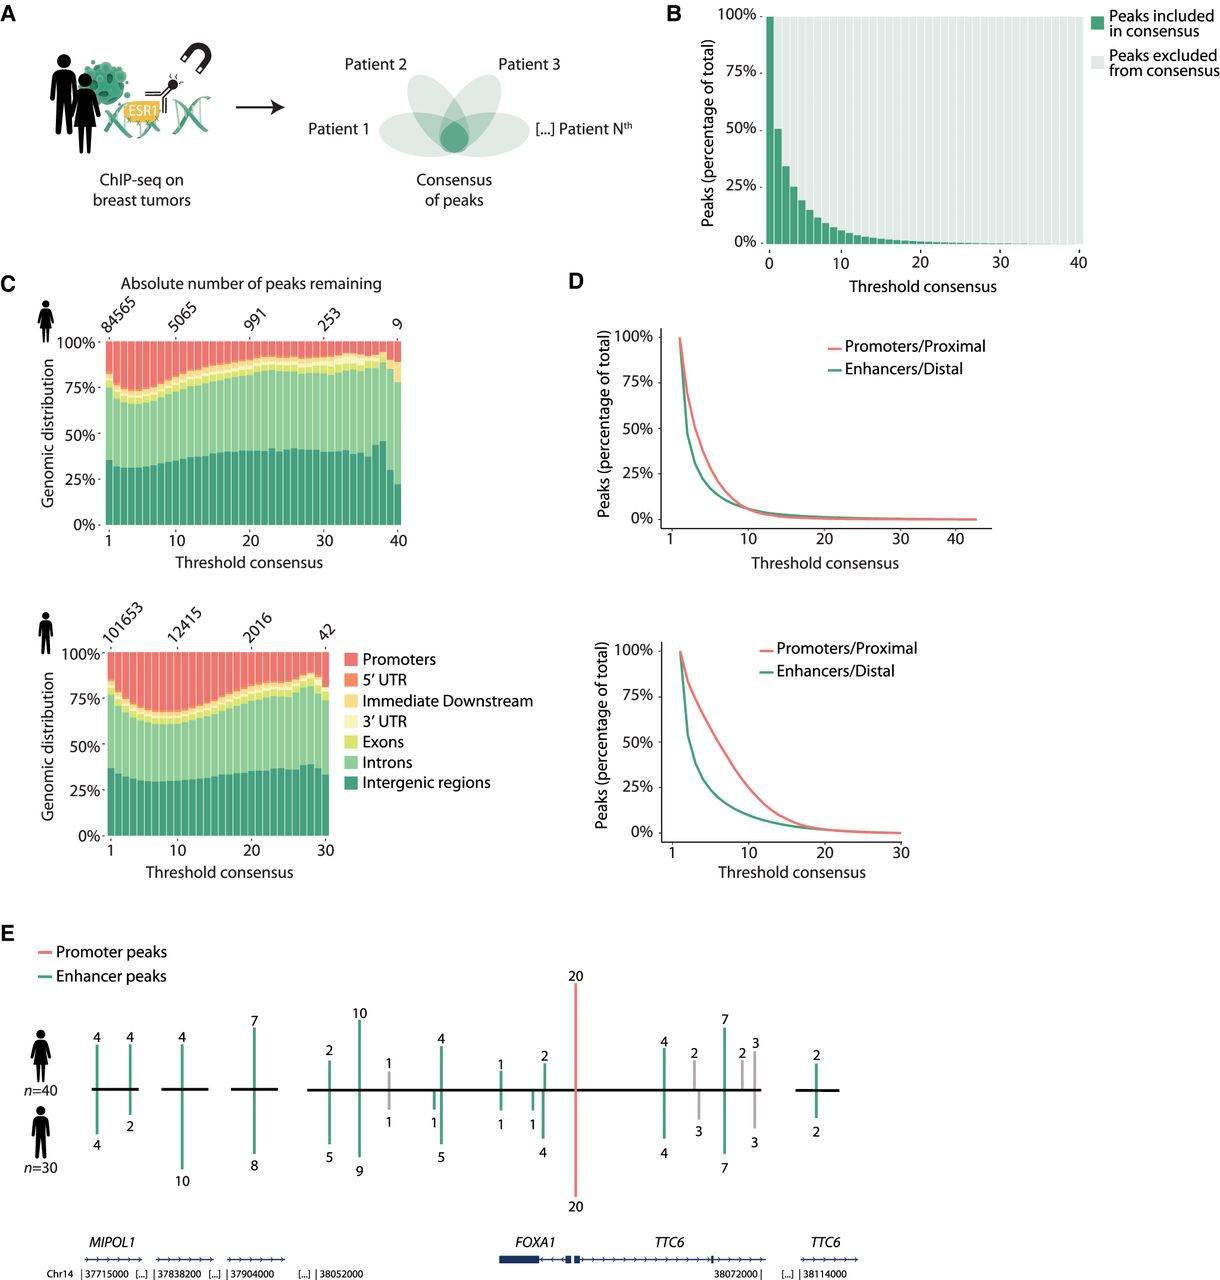
The largest inter-patient heterogeneity in ESR1 chromatin binding is found at putative enhancers. (A) Graphical representation of study design. ESR1 ChIP-seq on tumor samples from 30 male and 40 female breast cancer patients analyzed for the level of overlap and biological features. For sample details, see Supplemental Table S1. (B) Percentage of ESR1 peaks included or excluded in consensus, by varying the threshold of minimal overlap of peaks between female patients. (C) Genomic distribution of ESR1 consensus by varying threshold in females. (D) Percentage of distal and proximal regions retained by varying threshold for consensus in females. (E) ESR1 binding sites in the vicinity of FOXA1, showing the number of patients in which these peaks were called. Green lines represent enhancer regions; red line indicates promoter. Enhancer regions were coupled to FOXA1 on the basis of work by Corces et al. (2018). Gray lines represent peaks that were not coupled to FOXA1 on the basis of work by Corces et al. (2018), but these are shown for completeness as they were located in between peaks that were coupled to FOXA1.


