
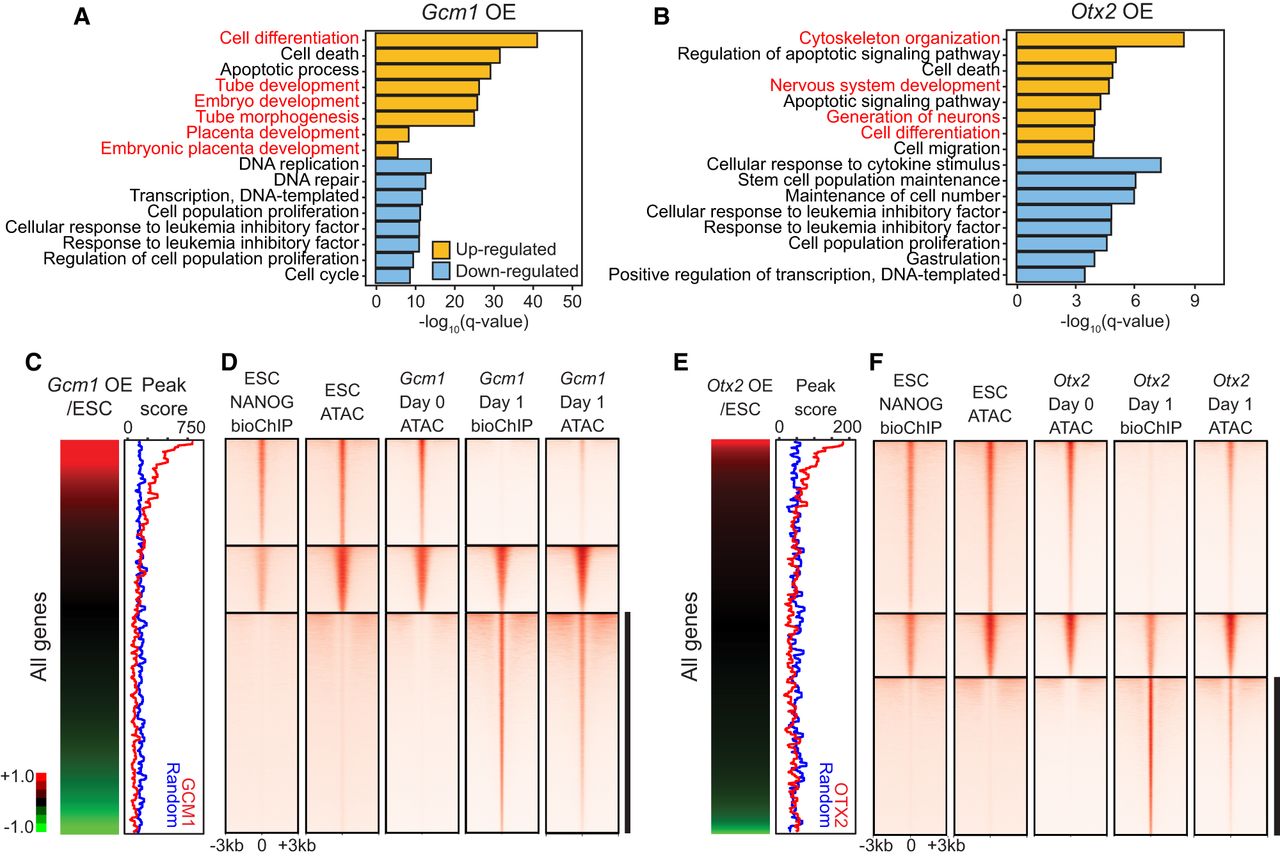
GCM1 and OTX2 function as activators and pioneer factors. (A,B) Selected GO biological process terms significantly enriched among differentially expressed genes up-regulated or down-regulated in Gcm1-overexpressing cells (A) or Otx2-overexpressing cells (B). (C,E, left) Expression profiles of Gcm1-overexpressing cells (C) or Otx2-overexpressing cells (E) with genes ordered by their expression levels in Gcm1/Otx2-overexpressing cells relative to the control ES cells. (Right) Corresponding peak scores to the expression profiles (red) and randomized peak scores (blue) are shown by applying moving window average (window size, 100; bin size, one). (D,F) bioChIP-seq of indicated TFs and ATAC-seq signals detected in control ES cells, −Dox cells (day 0), and Gcm1-overexpressing cells (D) or Otx2-overexpressing cells (F; day 1). Black bars indicate the regions closed in ES cells or day 0 cells but occupied by GCM1 (D) or OTX2 (F) and become open.


