
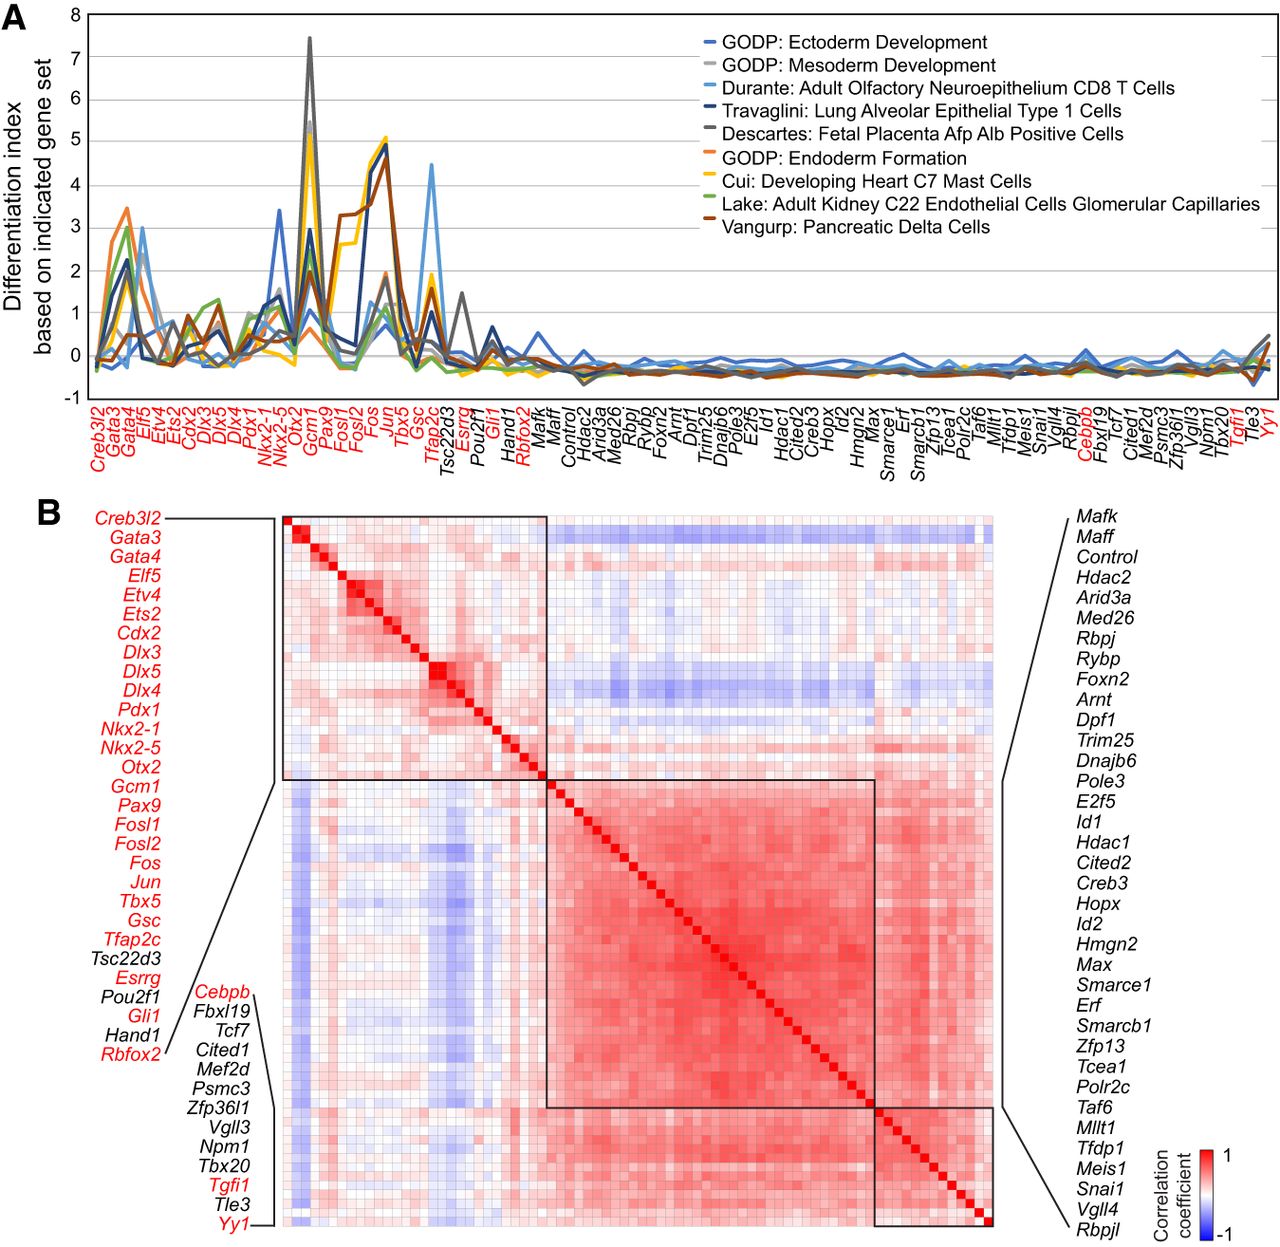
iTF-mediated lineage specification. (A) Differentiation index calculated with gene expression responses to the induction of 80 individual TFs (day 1) and indicated gene sets obtained from MSigDB signature gene set collection. Red text indicates TFs harboring cell fate conversion potential defined by differentiation indexing (Fig. 3A). (B) Similarity matrix of iTFs calculated from the differentiation indexes, which were based on all pairs of iTFs and 643 gene sets from MSigDB. Some groups of TFs show high similarity and form clusters of red cells and black boxes, meaning they have similar differentiation indexes across various cell type– or lineage-specific gene sets. Red text indicates TFs with cell fate conversion potential defined by differentiation index.


