
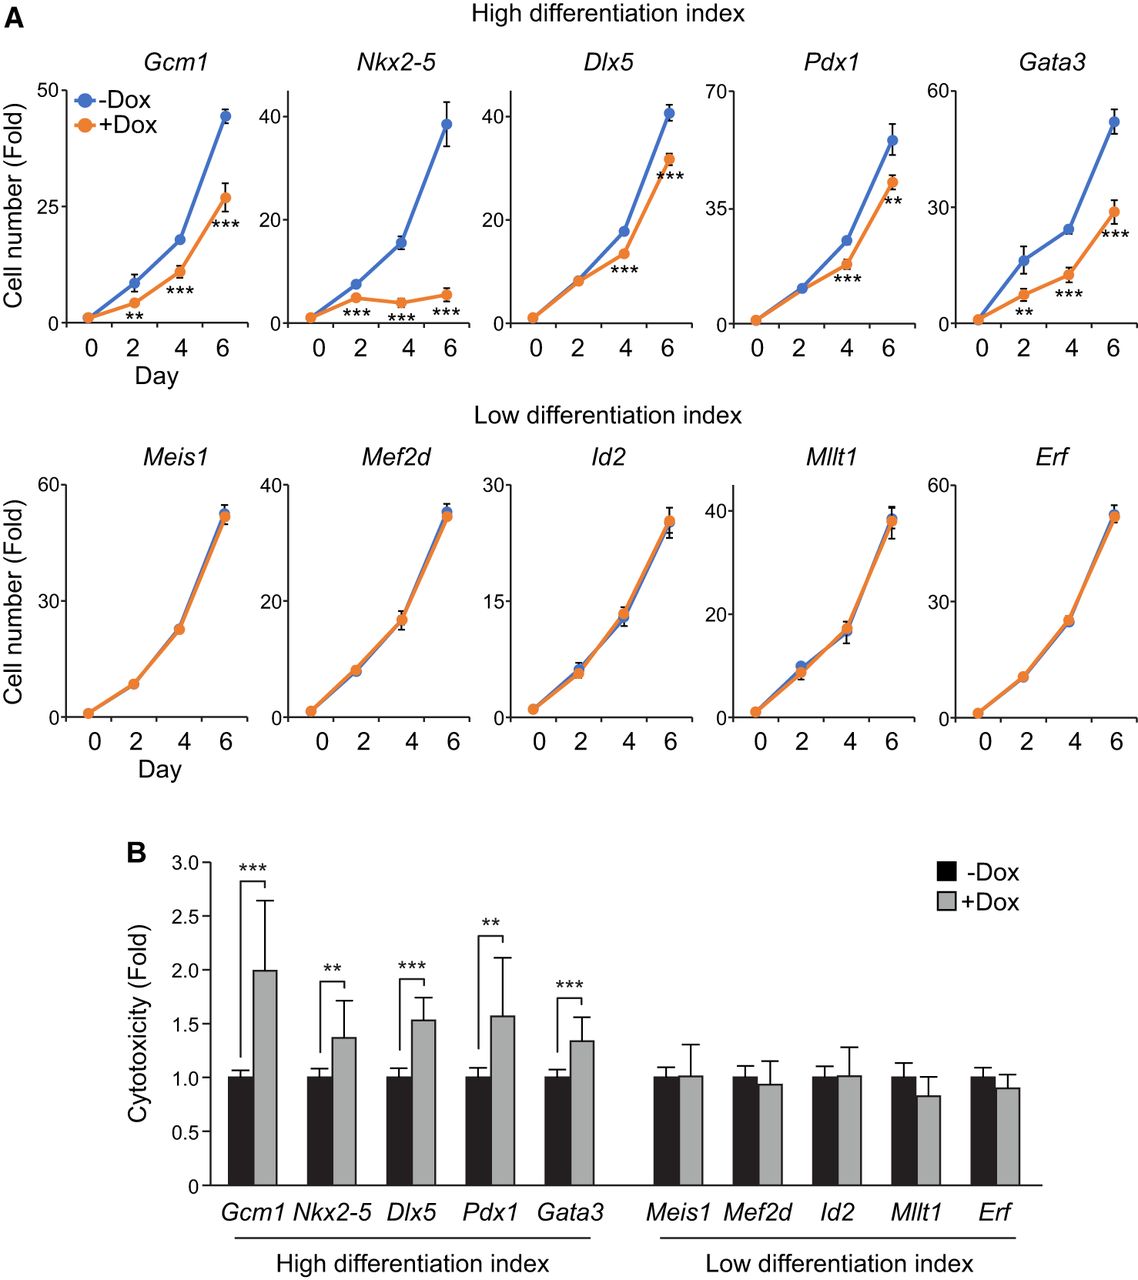
ES cells experiencing fate changes show slower proliferation and increased cell death. (A) Line plots depicting the time course measurement of cell number upon overexpression of iTFs via Dox induction (0.5 µg/mL; +Dox). The untreated cells (−Dox) were used as a control. The top row represents iTFs with high differentiation indexes, and the bottom row represents iTFs with low differentiation indexes. Cell numbers were counted up to 6 d after Dox induction, and the fold changes in cell numbers from day 0 were calculated and plotted (n = 2). Data were represented as mean ± SD, and a Student's t-test was performed to determine significance between −Dox and +Dox: (**) P < 0.01, (***) P < 0.001. (B) A bar plot shows the fold change in cell death in 10 iTF lines upon overexpression of the iTF by treating Dox (0.5 µg/mL) for 2 d. The cytotoxicity was calculated by measuring lactate dehydrogenase (LDH) activities in the culture media. The percentage of cytotoxicity was calculated for each value by dividing it against the value from the wells treated with lysis buffer, which provided the maximum LDH activity. The fold change was calculated against the control samples. Finally, the average percentage of cytotoxicity was calculated across replicates (n = 3–6), and a Student's t-test was performed to determine significance: (**) P < 0.01, (***) P < 0.001.


