
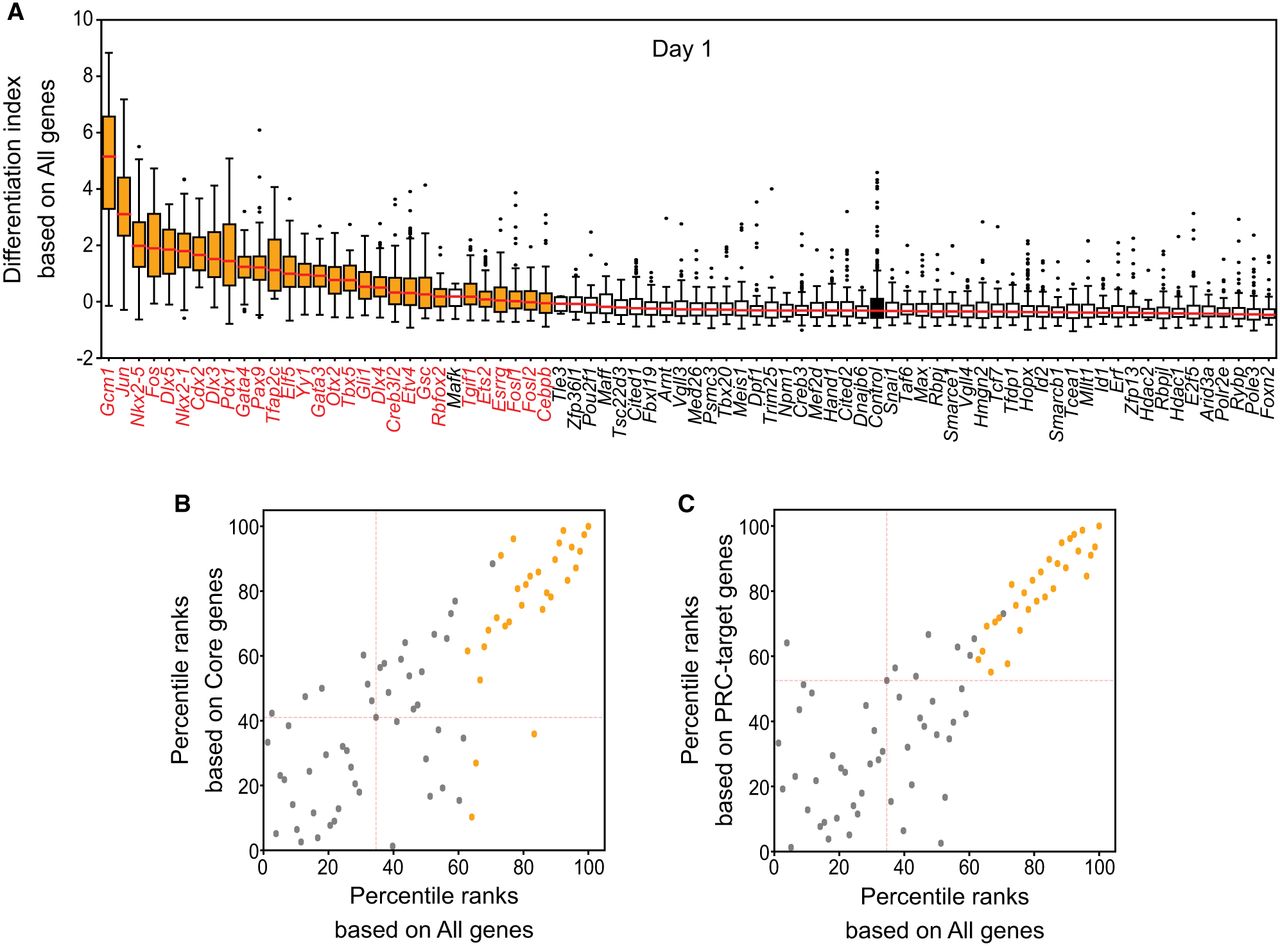
Determining cell fate changes by calculating differentiation index. (A) Differentiation index for cells expressing single iTF and control cells. Each box plot shows the distribution of the differentiation index for each cell population expressing one iTF (medians are marked with red lines). TFs with cell fate conversion potential are marked with orange, and the control is black. Mafk was not significant based on adjusted P-value. (B,C) Comparison between differentiation indexes based on all detected genes (all genes) and core pluripotency genes (core genes; B) or PRC target genes (C) after 1 d of induction (because the differentiation indexes for each gene group have different ranges, percentile ranks were used). TFs with cell fate conversion potential are marked with orange. Red dashed lines show the location of control cells. Some TFs (gray dots), like Mafk, are located near or even in the cluster of TFs with cell fate conversion potential (orange dots). These TFs were not selected based on the results of statistical testing.


