
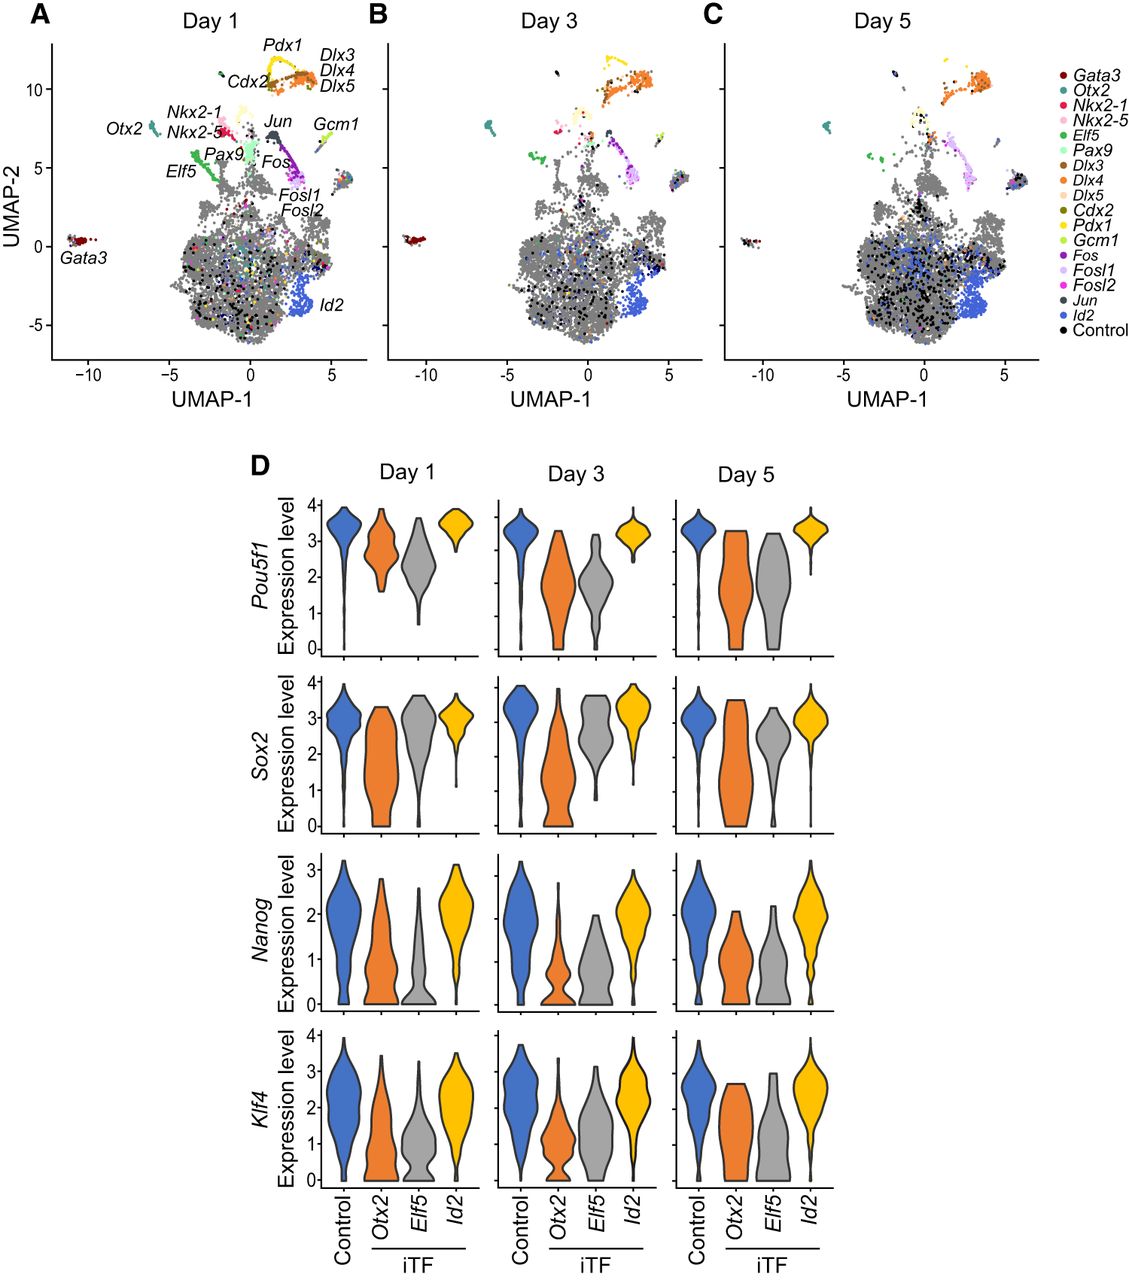
Figure 2.
iTF-seq enables search for TFs with cell fate conversion potential. (A–C) UMAP plots of cells expressing individual iTFs and control cells after 1, 3, and 5 d of induction. Some iTF-expressing cells and control cells are marked with colors. (D) Relative expression levels of ESC markers (Pou5f1, Sox2, Nanog, and Klf4) in control and Otx2-, Elf5-, and Id2-expressing cells after 1, 3, and 5 d of induction.


