
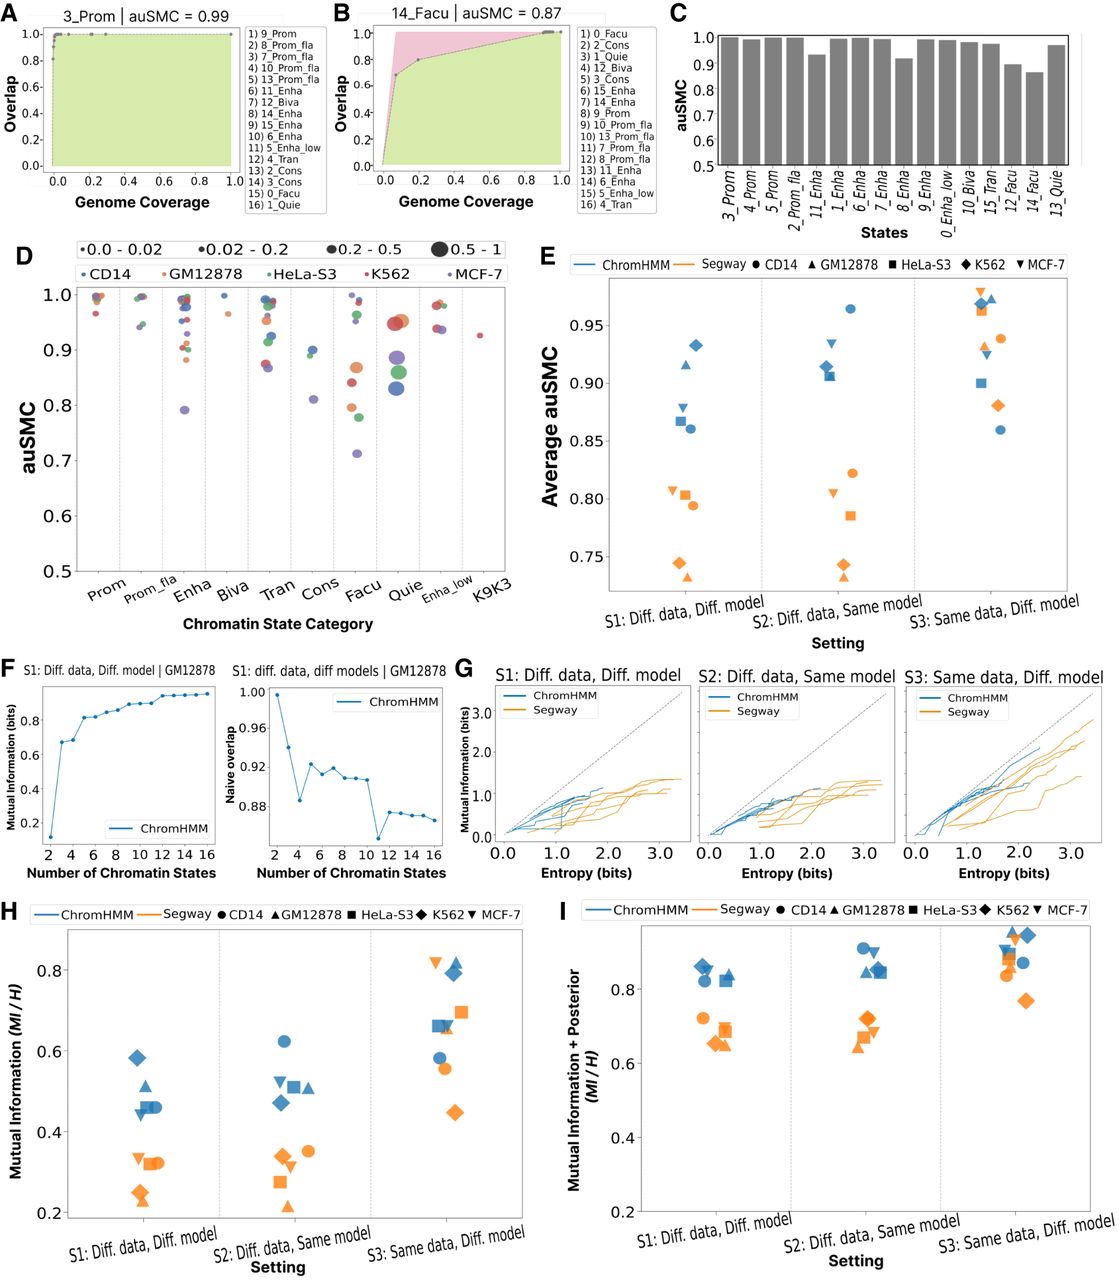
Evaluation of reproducibility as a function of granularity of chromatin state. (A) For a given state in the base annotation Bi, we ordered all states in the verification annotation V according to their IoU overlap. The leftmost dot indicates the most-overlapped verification state, Vj; the horizontal axis indicates Vj’s genomic coverage; and the vertical axis indicates the fraction of Bi overlapping with Vj. The second point corresponds to the union of Vj with the second-most enriched verification state, and so on for subsequent points. This forms an ROC-like curve, with the green area representing the area under the curve (AUC) for the observed overlap versus genomic coverage of each state, and the red area indicating deviation from perfect reproducibility in which the first verification state covers all positions of target state Bi. The area under the state-merging curve (auSMC) ratio is a numerical representation of reproducibility as a function of chromatin state granularity, which is calculated by dividing the observed AUC by the AUC pertaining to the perfect reproducibility. In other words, a larger red area corresponds to lower auSMC. Results are shown for the 3_Prom(B) chromatin state in the base annotation obtained from our running example (S1; ChromHMM, GM12878). Lists of chromatin state names on the right of A represent states in the verification annotation sorted according to their IoU overlap with the target chromatin state in the base annotation. (B) Same as A, but for facultative heterochromatin 14_Facu(B). (C) auSMC ratio of chromatin states in the running example (S1; ChromHMM, GM12878). (D) auSMC ratio of various chromatin states categories identified in the ChromHMM annotation according to S1 (different data, different models) for five cell types. Each dot represents a chromatin state, with color denoting cell type and size proportional to genome coverage. (E) Average auSMC ratio (weighted by the genome coverage) across two SAGA models, five cell types, and three settings. Color denotes the SAGA model, and shapes represent cell types. (F) Mutual information (left) and naive overlap (right) as a function of the number of chromatin states, for our running example (S1; ChromHMM, GM12878). The horizontal axis indicates the number of states; the default 16-label model is on the far right, and each dot to the left represents an annotation after merging two labels in the annotation to its right. Mutual information indicates the number of bits of information about the verification state that is gained by observing the base state (Methods). (G) Mutual information between base and verification replicates after merging labels, as a function of the entropy of the base annotation. In a perfectly reproducible case, the amount of mutual information would be equal to the entropy. Color denotes SAGA model (Segway or ChromHMM). (H) Mutual information between base and verification annotations across two SAGA models, five cell types, and three settings as a fraction of the base annotation entropy. (I) Same as H, but evaluating the mutual information when observing both the label and posterior probability (Methods).


