
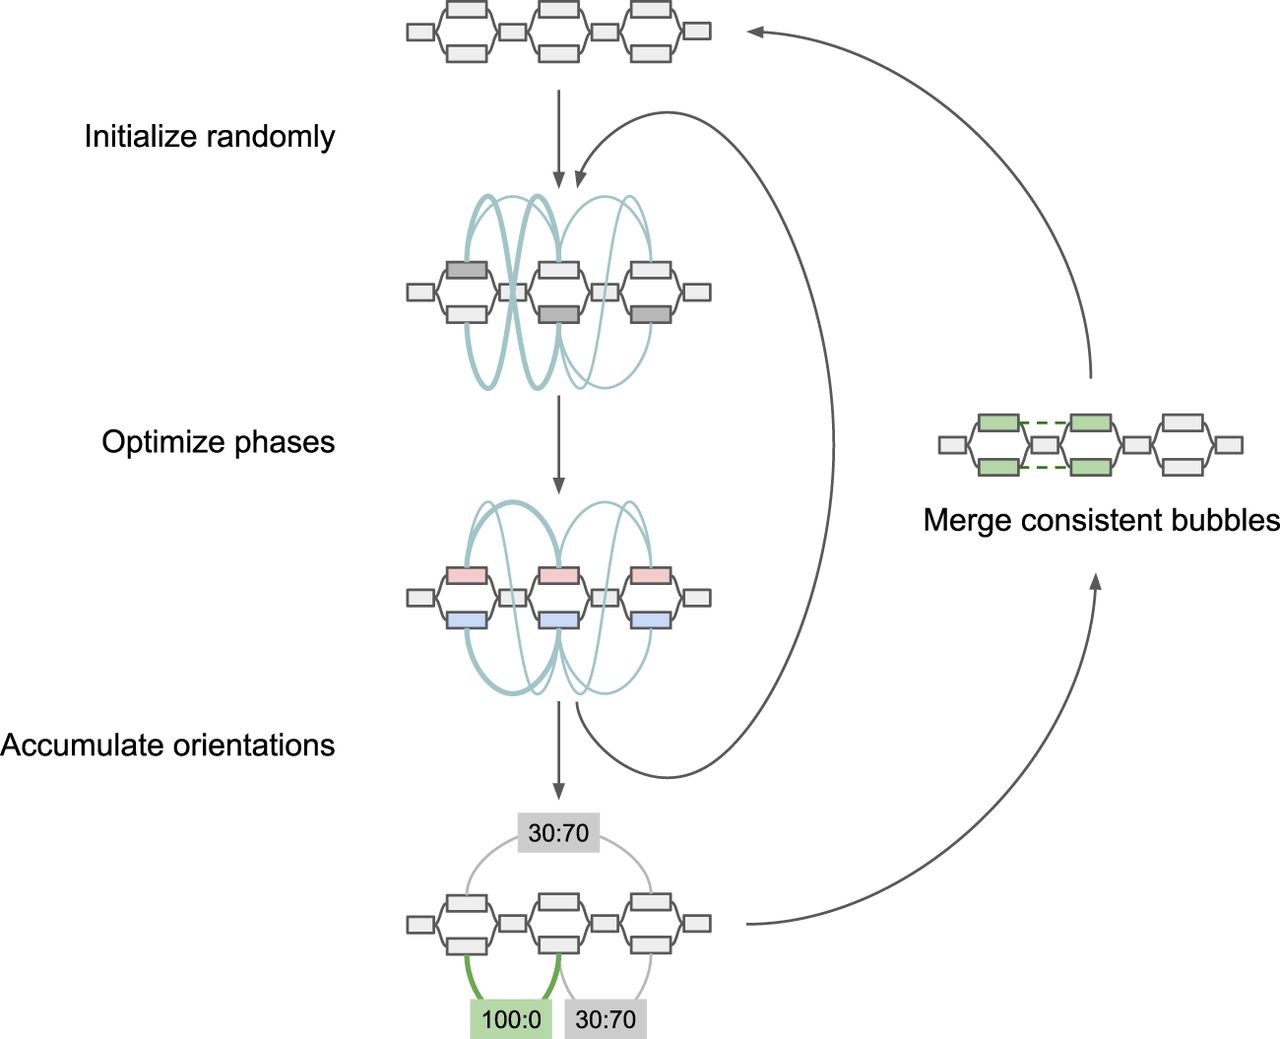
Figure 6.
Diagram of sampling method for optimizing proximity linkages in an assembly graph. Edge weights in the contact graph are represented by teal curves. For each inner iteration, a greedily converged phase state is used to update a distribution of orientations among bubbles. Bubbles with the strongest signal at the end of sampling are merged for successive iterations. By the end of each round r of merging, the largest possible bubble set is 2 ^ r in size.


