
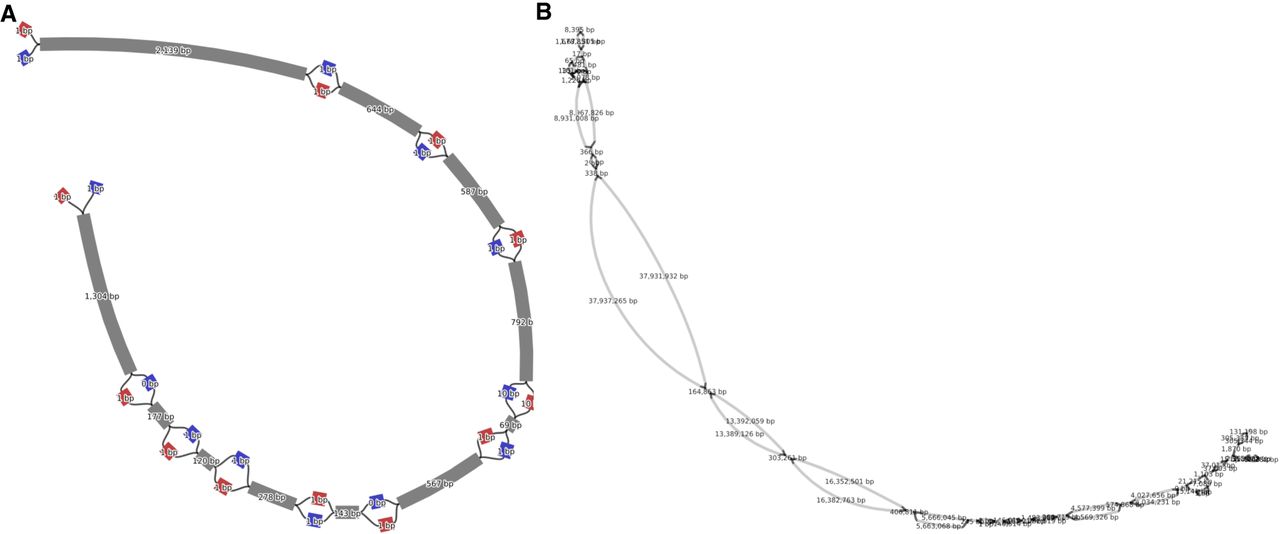
Figure 5.
The two types of Shasta output graphs, visualized as a 2D layout in Bandage (Wick et al. 2015) at two different scales. (A) A subregion of the “Assembly-Detailed.gfa,” showing near-variant scale nodes in a bubble chain and their phasing indicated by colors produced by Shasta. (B) A subregion of the “Assembly-Phased.gfa” showing a phased portion of Chr 11 from HG002, which terminates at two tangles, presumably caused by telomeric and centromeric sequences.


