
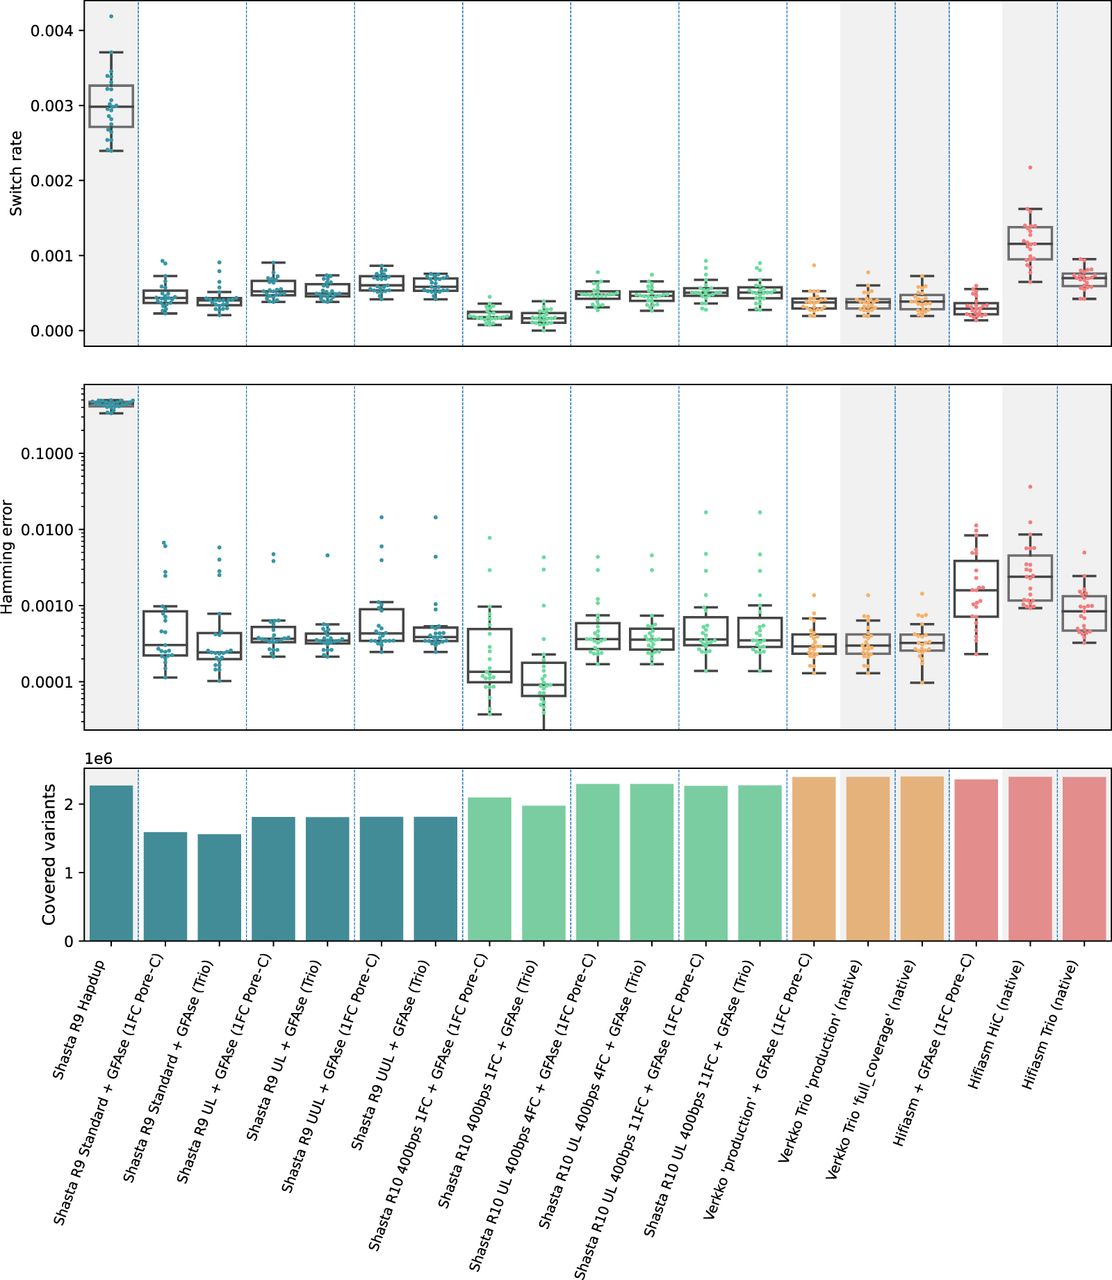
Figure 3.
Phasing metrics for HG002 assemblies, as evaluated using the GIAB v4.2.1 benchmark VCF, phased with Strand-seq using WhatsHap (see Methods). All Shasta assemblies are unpolished. Assemblies not phased with GFAse are shaded gray. Each dot represents a chromosome error rate, generated by WhatsHap compare. Native Hifiasm Hi-C uses 30× coverage. Each pair of Hi-C is ∼17×. Pore-C flow cells have ∼30× yield.


