
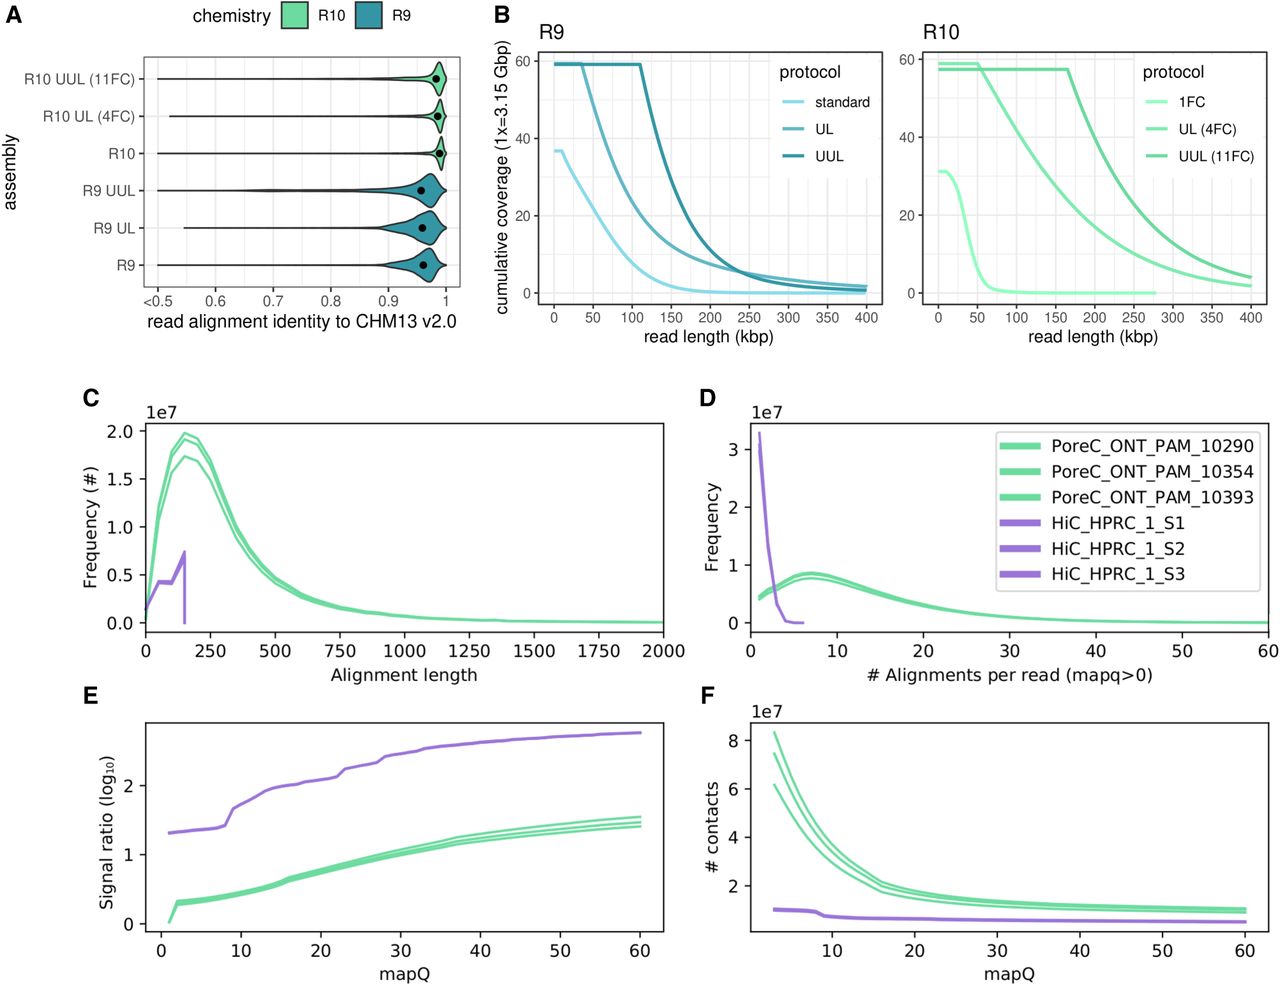
Distributions of read accuracy, coverage, length for reads used in assembly phasing, and phasing signal for proximity-ligated reads. (A,B) Identity and length metrics for nanopore read sets used in the HG002 evaluation. (C–F) Pore-C and Hi-C metrics for contacts and signal ratio, measured on a per-library basis. “Alignment length” and “alignments per read” are proxies for subread statistics. Only mappings that are usable for phasing are shown, that is, with mapping quality (mapQ) > 0 in a diploid reference. Signal ratio is computed using a high-quality trio-phased assembly to indicate the number of consistent and inconsistent contacts (see Methods).


