
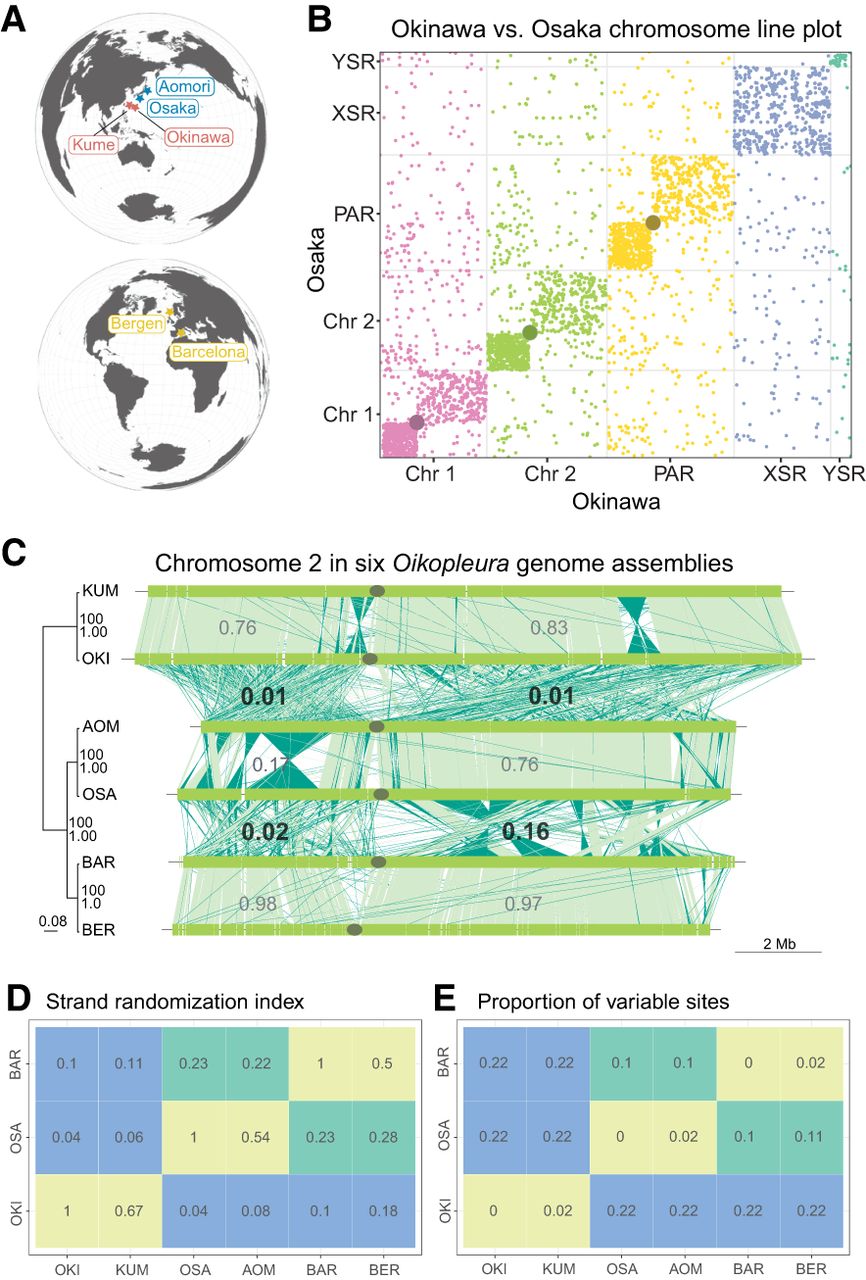
Extensive genomic rearrangement in Oikopleura dioica lineages. (A) Geographical map locating the origin of the lineages and assemblies. (B) Line plot representation of the whole-genome alignment between the Okinawa and Osaka genomes. Each chromosome is plotted in a different color that will identify them in the following figures. A gray dot is overlaid at the position of centromeres. (C, left) Maximum likelihood phylogenetic tree of 5162 single-copy orthologous genes common to all O. dioica genomes. The tree is midpoint-rooted with clade support values indicating bootstrap values from RAxML and Bayesian posterior probability from MrBayes. Branch lengths are proportional to the estimated number of substitutions per nucleotide site. (Right) Pairwise comparisons of Chromosome 2 between Oikopleura genomes (names abridged with their first three letters). Dark green indicates plus/minus-strand alignments; the gray ellipse, the centromere. The numbers indicate the scrambling index computed for a given arm pair. (D,E) Scrambling index (D) and proportion of variable sites (E) across all single-copy orthologous nucleotide sequences for same-lineage (green), Osaka–Barcelona (yellow), and Okinawa–other (red) pairs of genomes.


