
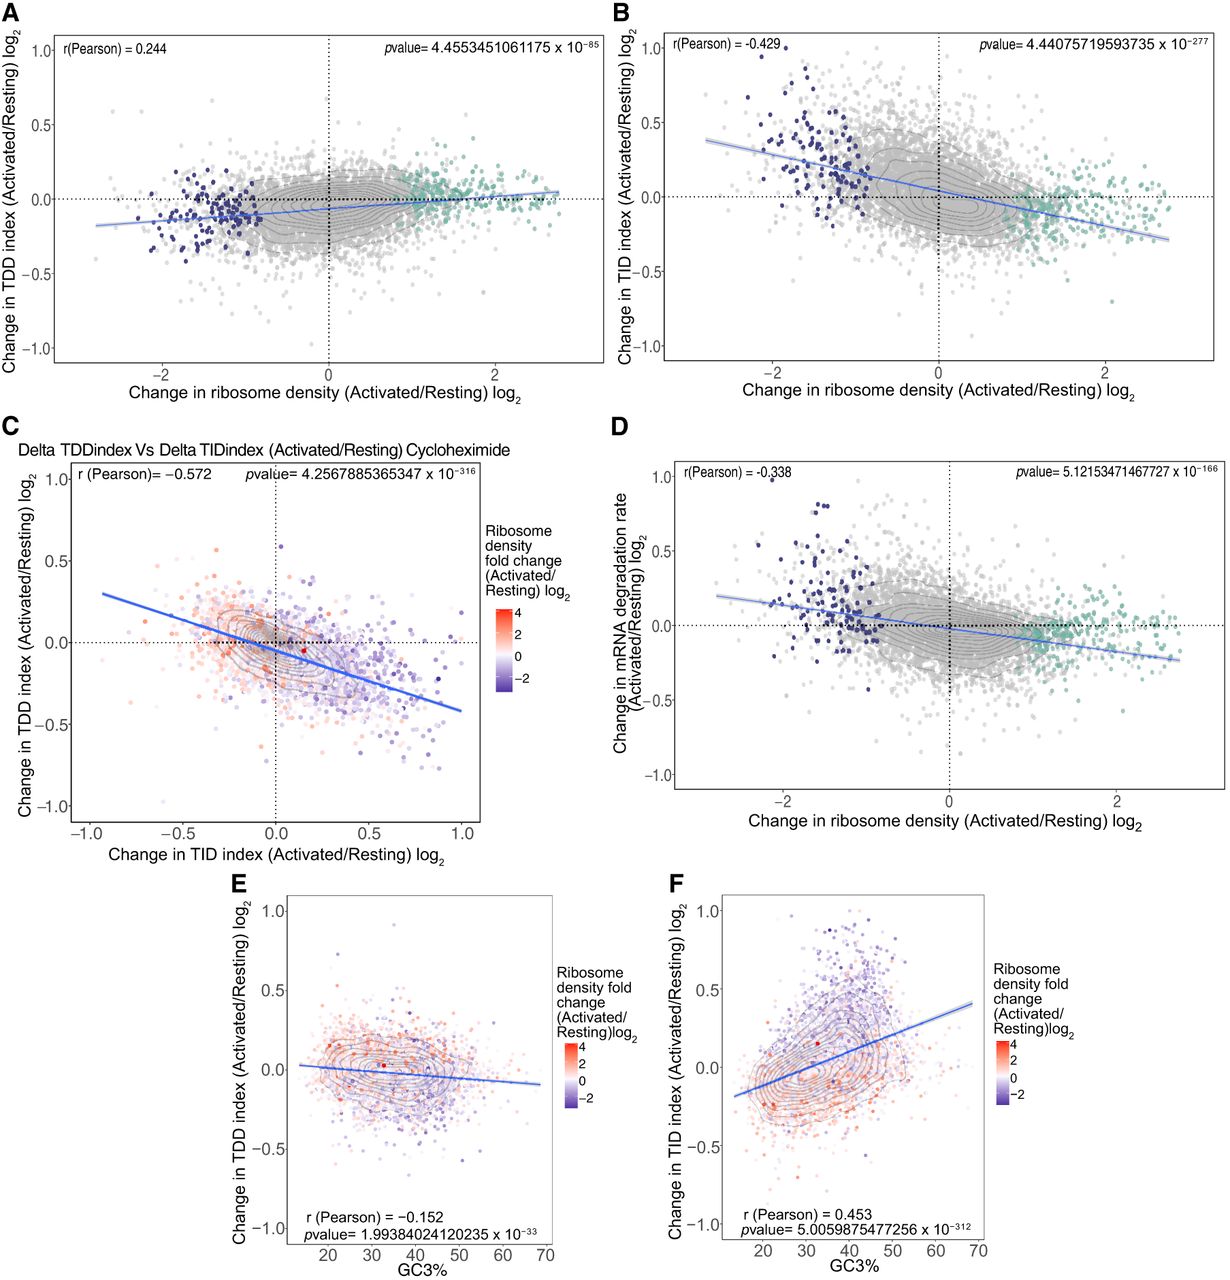
Changes in ribosome density upon T cell activation modulate both TDD and TID. (A) Scatter plot of the changes in ribosome density between resting and activated cells (x-axis) against the changes in the TDDindex (y-axis). Each dot corresponds to a single transcript. Violet and green dots correspond to transcripts from Figure 1D displaying a significant decrease (violet) or increase (green) in ribosome density upon T cell activation. (B) Scatter plot of the changes in ribosome density between resting and activated cells (x-axis) against the changes in the TIDindex (y-axis). (C) Scatter plot of the change in TDDindex (y-axis) and TIDindex (x-axis) between resting and activated cells. Transcripts are colored with respect to the change in ribosome density measured between resting and activated cells. (D) Scatter plot of the changes in ribosome density between resting and activated cells (x-axis) against the changes in mRNA degradation rate (y-axis). (E,F) Scatter plot of the GC3% against changes in TDDindex and TIDindex between resting and activated cells.


