
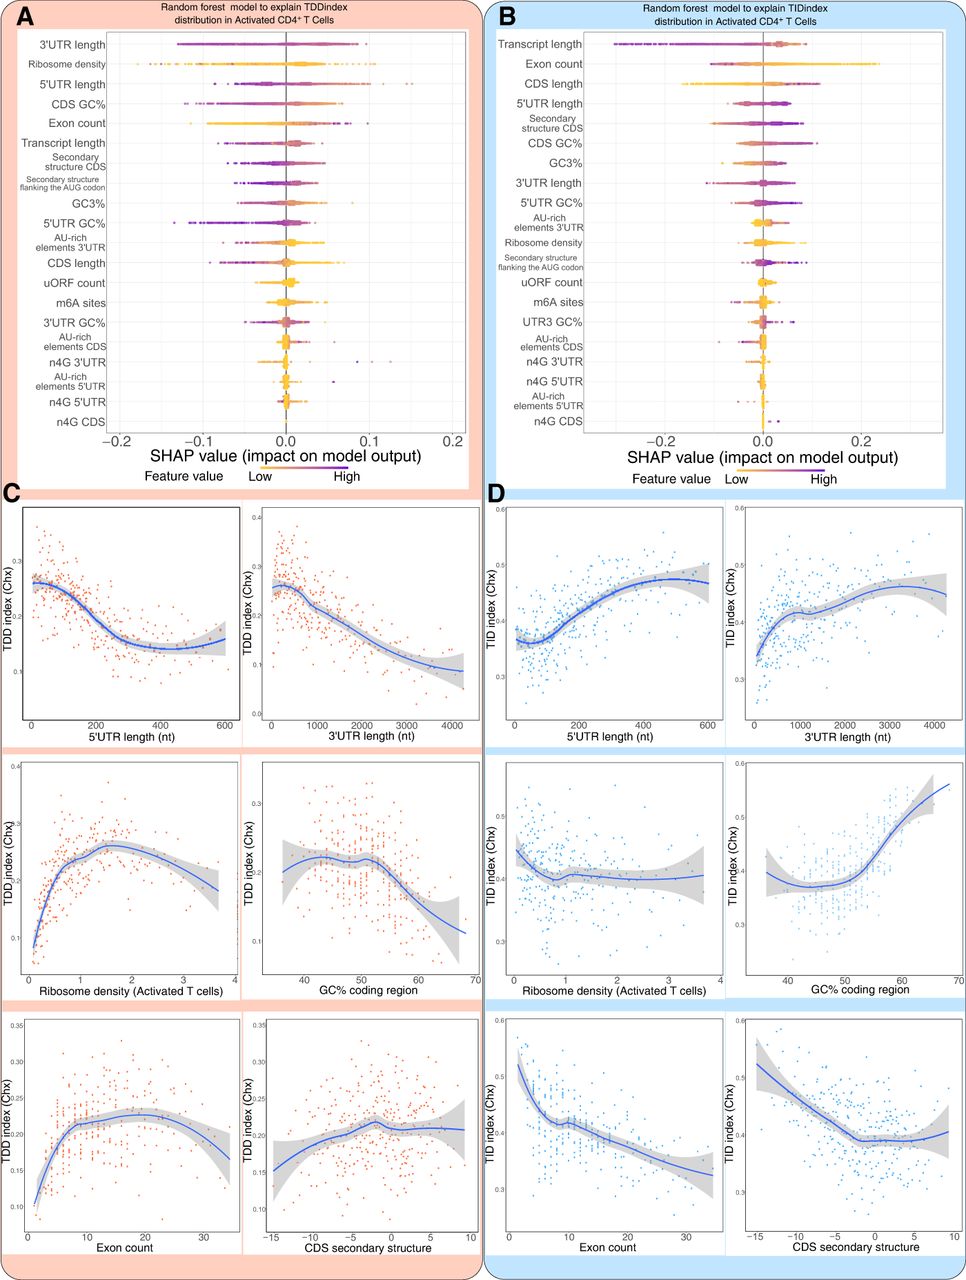
Comparison of features associated with TDD in resting and activated CD4+ T lymphocytes. (A,B) Random forest decision tree analysis (with SHAP value analysis for interpreting the output of the random forest model) of transcript features to explain the observed TDDindex (left) and TIDindex (right) values in activated CD4+ T lymphocytes. Features are sorted from top to bottom with respect to their importance in predicting the TDDindex or TIDindex. (C,D) Binning plots of TDDindex (left) or TIDindex (right) against selected features. Transcripts are first ordered with respect to the feature to be compared with TIDindex and groups of 20 transcripts made along the selected feature. The mean TIDindex and feature values are plotted for each group.


