
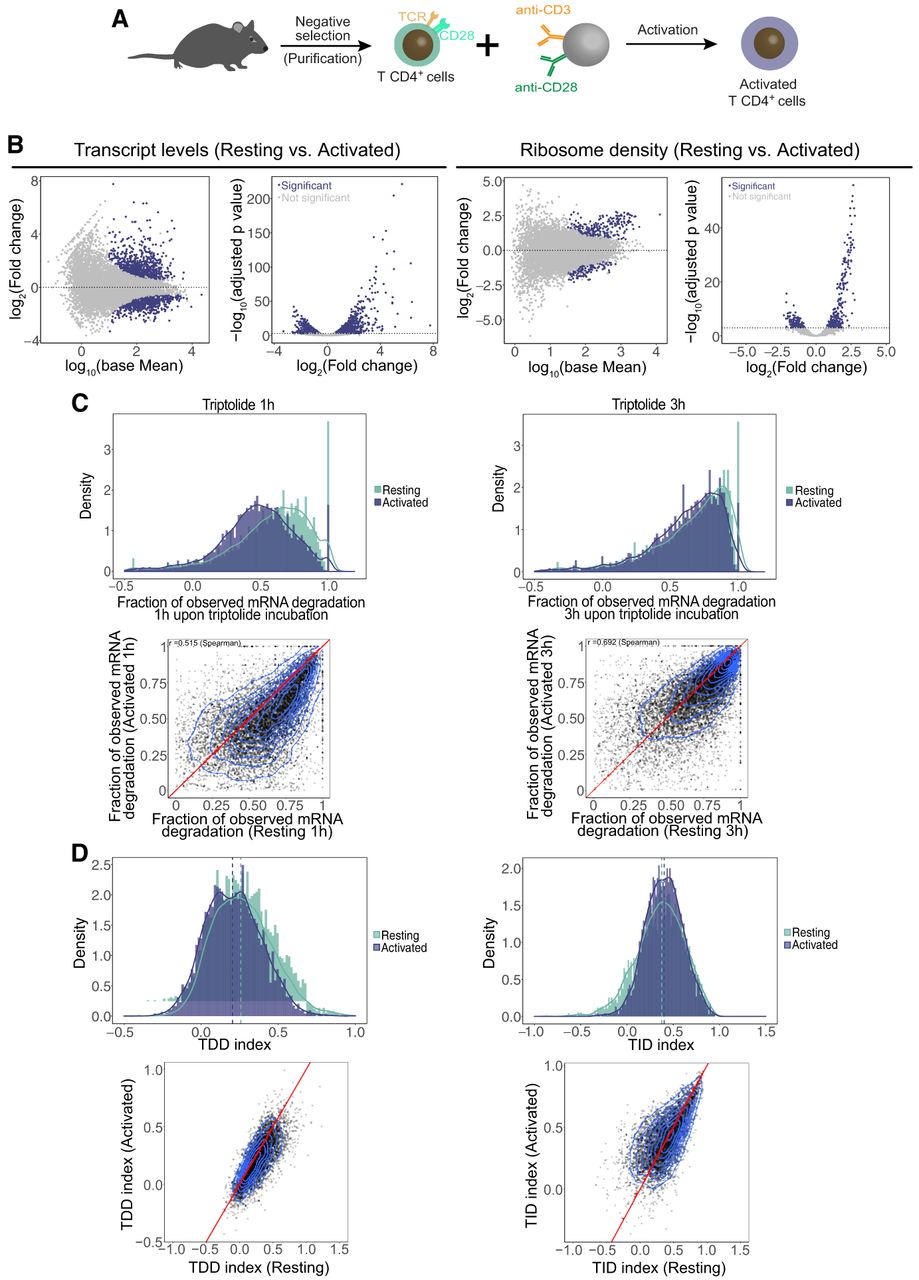
Figure 4.
Changes in RNA abundance, ribosome density, and mRNA decay rates induced by T cell activation. (A) Schematic representation of the procedure for activation of primary CD4+ T lymphocytes. (B) Differential gene expression analysis of transcript abundance as measured by RNA-seq (left) and ribosome density as measured by ribosome profiling (right) in resting and activated cells. (C) Fraction of mRNA degradation in resting and activated T cells 1 and 3 h after transcription inhibition with triptolide. (D) Comparison of the distribution of the TDDindex (left) and TIDindex (right) in resting and activated T cells.


