
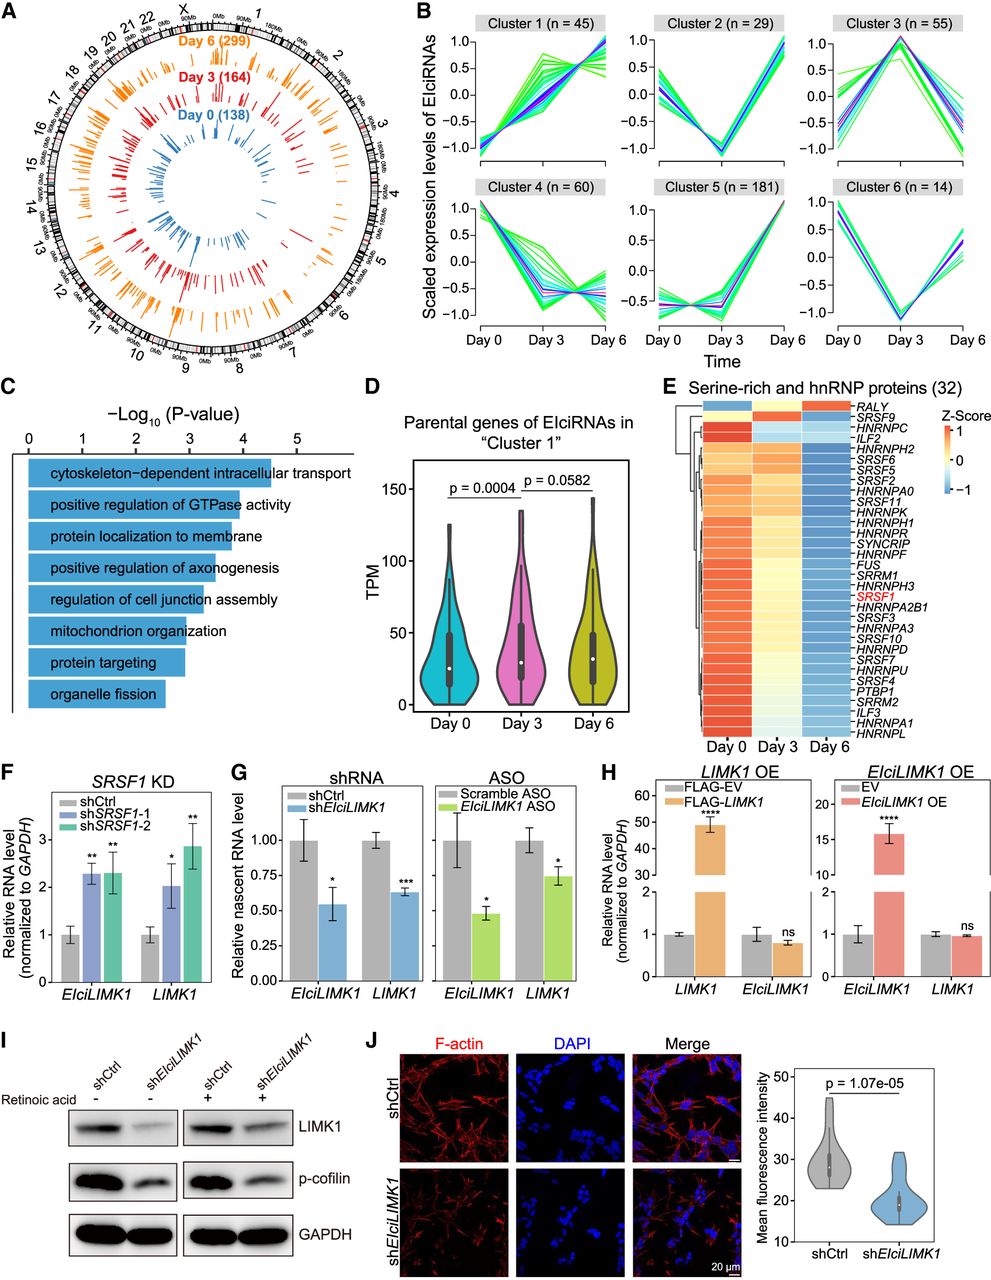
Functional roles of EIciRNAs in neuronal differentiation. (A) Circos plots (Krzywinski et al. 2009) showing genomic distribution (hg38) and backspliced reads per million (BRPM) of EIciRNAs at day 0, day 3, or day 6 after retinoic acid (RA)–induced SH-SY5Y differentiation. Two biological replicates were used for analysis. (B) Fuzzy clustering showing the temporal expression patterns of EIciRNAs during SH-SY5Y cell differentiation. (C) Enriched GO terms of parental genes of EIciRNAs (cluster 1 in B). (D) Violin plots displaying the expression levels (TPM) of EIciRNA (cluster 1) parental genes during SH-SY5Y cell differentiation. (E) Heatmap showing the expression levels of 32 serine-rich (SR) and HNRNP proteins during SH-SY5Y cell differentiation (Papasaikas et al. 2015). (F) RT-qPCR analysis of EIciLIMK1 and LIMK1 mRNA expression in SH-SY5Y cells after SRSF1 knockdown. (shCtrl) shRNA with scrambled sequences, (shSRSF1-1 and shSRSF1-2) two independent shRNAs against SRSF1. (G) Nuclear run-on assay showing the nascent level of LIMK1 mRNA in SH-SY5Y cells after EIciLIMK1 knockdown with shRNA or ASO against the EIciLIMK1 BSJ. (Scramble ASO) ASO with scrambled sequences. (H) RT-qPCR analysis of EIciLIMK1 and LIMK1 mRNA expression in SH-SY5Y cells after overexpression of LIMK1 (left) and EIciLIMK1 (right). (I) Western blot showing the expression levels of LIMK1 and phosphorylated cofilin (p-cofilin) protein levels in SH-SY5Y cells in uninduced and RA-induced SH-SY5Y cells after EIciLIMK1 knockdown. GAPDH was used as the loading control. (J) Representative immunofluorescence (IF) images of F-actin in RA-induced SH-SY5Y cells after EIciLIMK1 knockdown (left). The F-actin fluorescence intensity was quantified with Fiji (right). N = 40. In D and J, P-values were calculated with the Wilcoxon rank-sum test. In F–H, error bars represent SD in triplicate experiments, and P-values were calculated with the two-tailed Student's t-test. (*) P < 0.05, (**) P < 0.01, (***) P < 0.001, (****) P < 0.0001.


